Estimation of Room Impulse Responses from Handclaps

Shih-Yu Lai1,2,3, Kyung Yun Lee2, Nils Meyer-Kahlen2, Eloi Moliner2, Bing-Yu Chen1, Vesa Välimäki2
1National Taiwan University   2Aalto University
3MoonShine Animation Studio
Spectra and RMS envelopes of recorded handclaps and inferred RIRs in two rooms

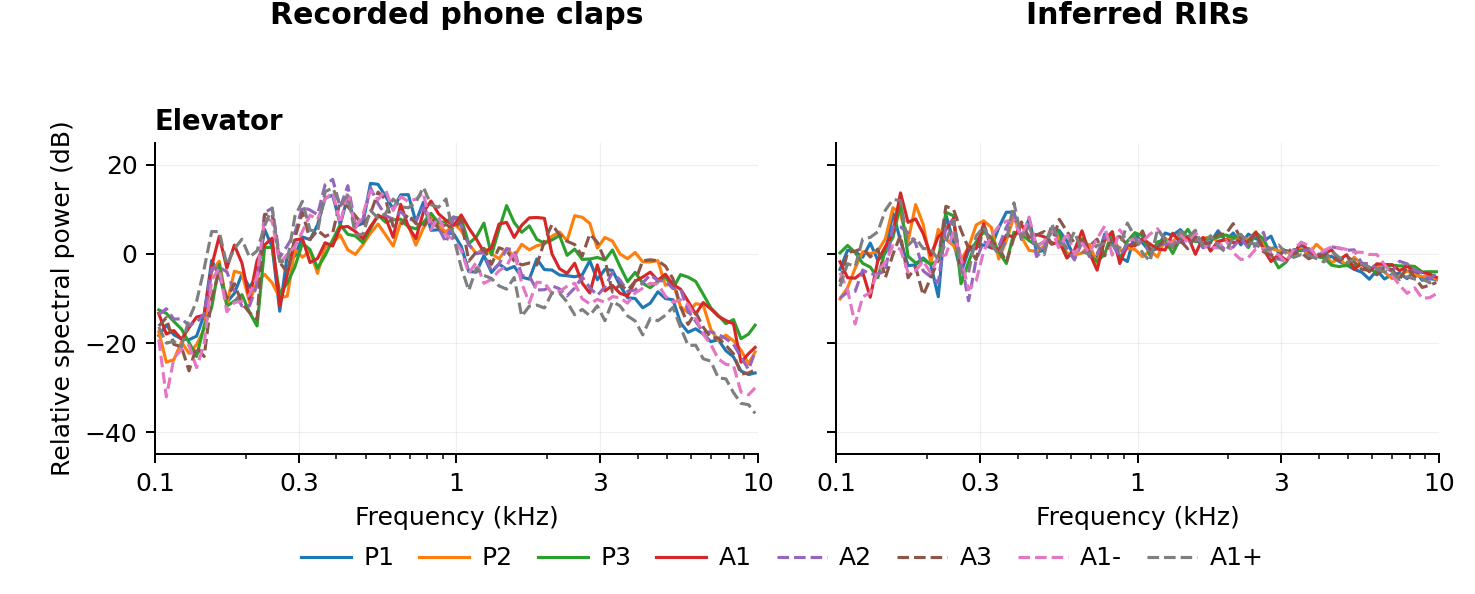
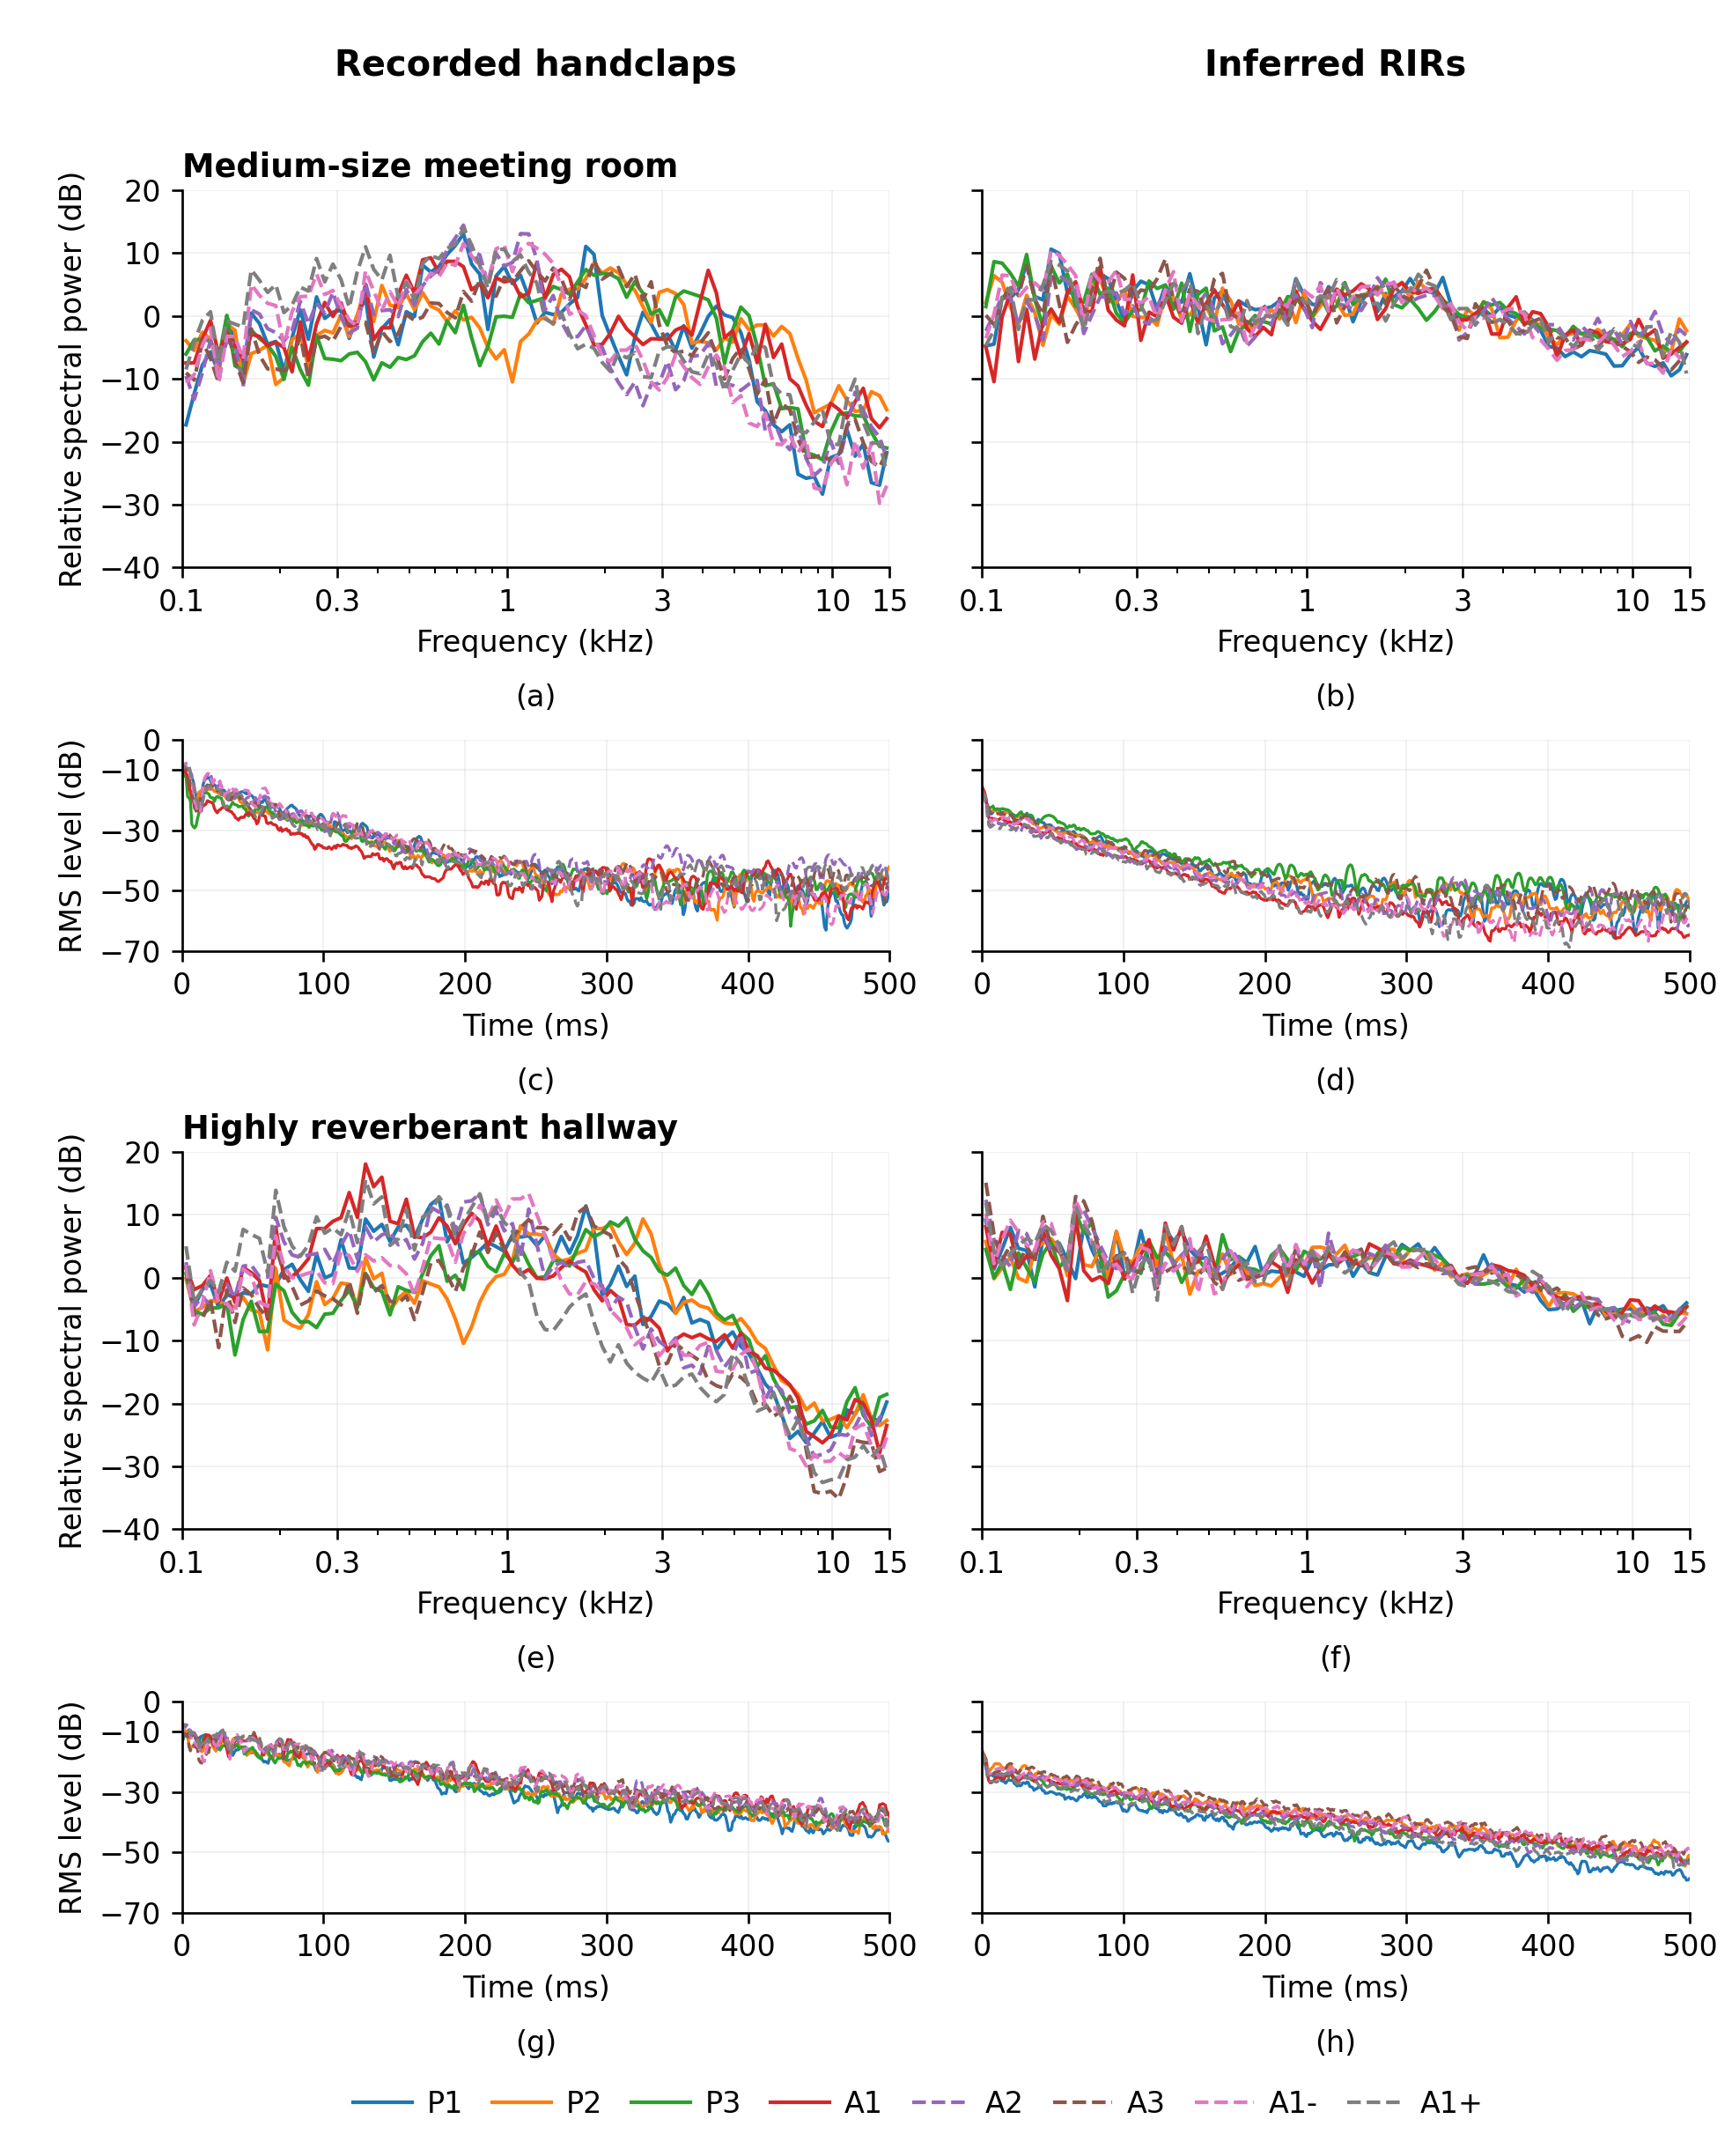
Eight handclap modes, two rooms. Spectra and RMS envelopes of recorded handclaps (left) and their inferred RIRs (right), shown over 500 ms so the longer decay of the hallway is visible. Levels are in dB and retain the original digital levels.

From a handclap to a room response

Handclaps offer an equipment-free excitation for room acoustics, but the source waveform varies with the person and hand configuration. We study supervised estimation of a one-second room impulse response (RIR) from a reverberant handclap, using controlled training pairs made with recorded anechoic handclaps and RIRs.

This page provides additional real phone-recording examples for listening and visual inspection. The phone recordings have no paired reference RIR, so these examples illustrate model behavior and do not establish reconstruction accuracy.
Listen: phone-recorded handclaps and inferred RIRs

iPhone 15 recordings from seven rooms, originally at 48 kHz and resampled to 44.1 kHz. Every room contains eight protocol modes with five repetitions each. The default example for each room and mode is the existing unclipped recording with the highest pre-handclap SNR, selected using only the input.

Both players use the original one-second model interval. Each WAV is independently peak-normalized to −1 dBFS for listening only; no denoising or filtering is applied. Listen for the onset and decay of each inferred response, and compare the two rooms. There is no paired reference RIR.

Download the six paper-selected P1/P2/P3 pairs (ZIP) · Recording inventory

Medium-size meeting room

Medium-size meeting room — documented phone-recording room

P1 · repetition 3 · input-selected example

Download recording · Download inferred RIR

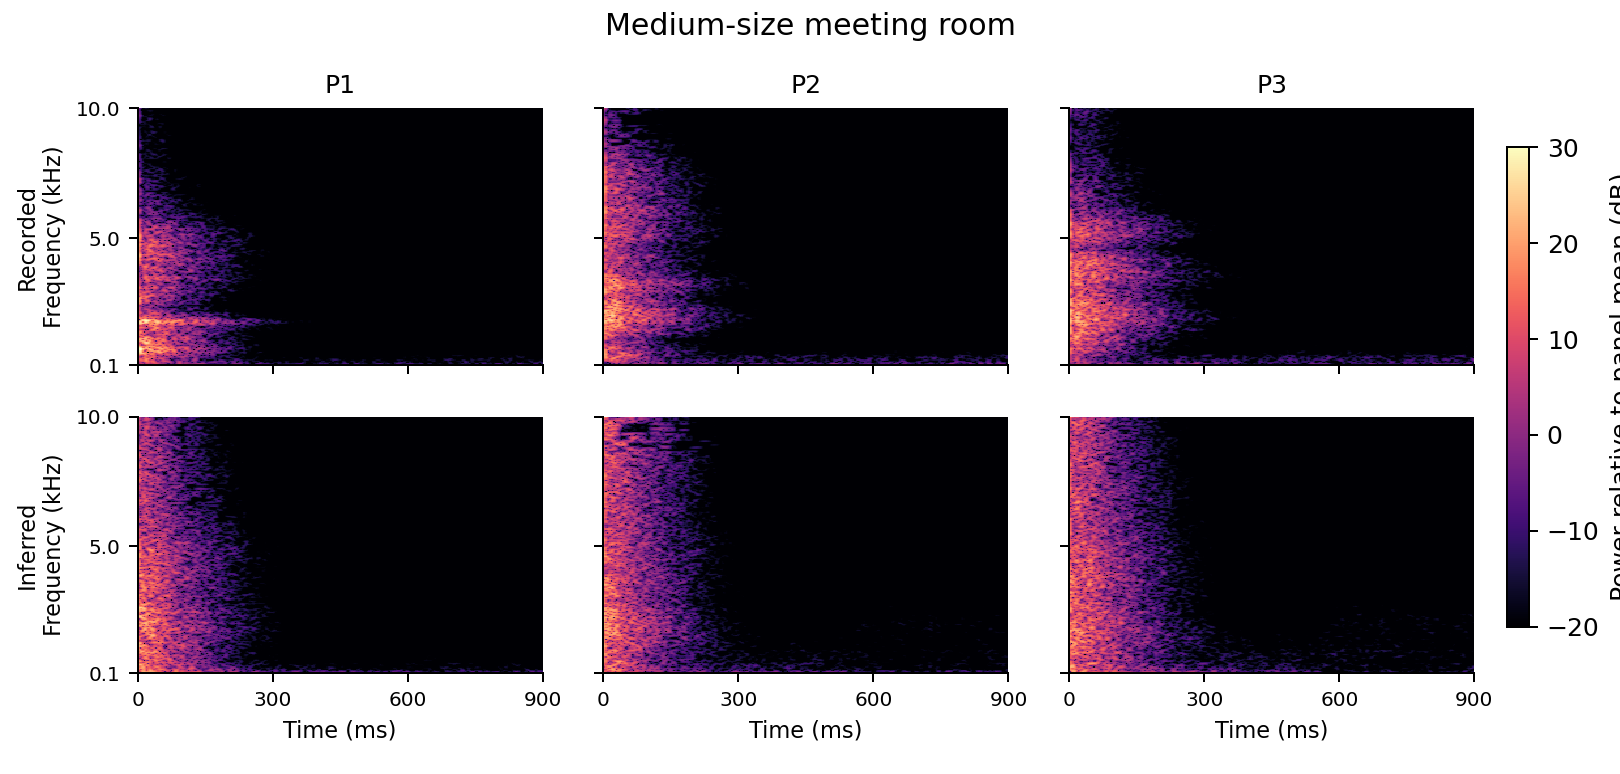
Spectrogram overview: selected P1/P2/P3 Medium-size meeting room: recorded and inferred spectrograms for input-selected P1, P2 and P3

Top: recorded claps. Bottom: inferred RIRs. Fixed input-selected examples, 0–0.9 s and 0.1–10 kHz, with a shared color scale.

All eight modes · Room spectra

Highly reverberant hallway

Highly reverberant hallway — documented phone-recording room

P1 · repetition 3 · input-selected example

Download recording · Download inferred RIR

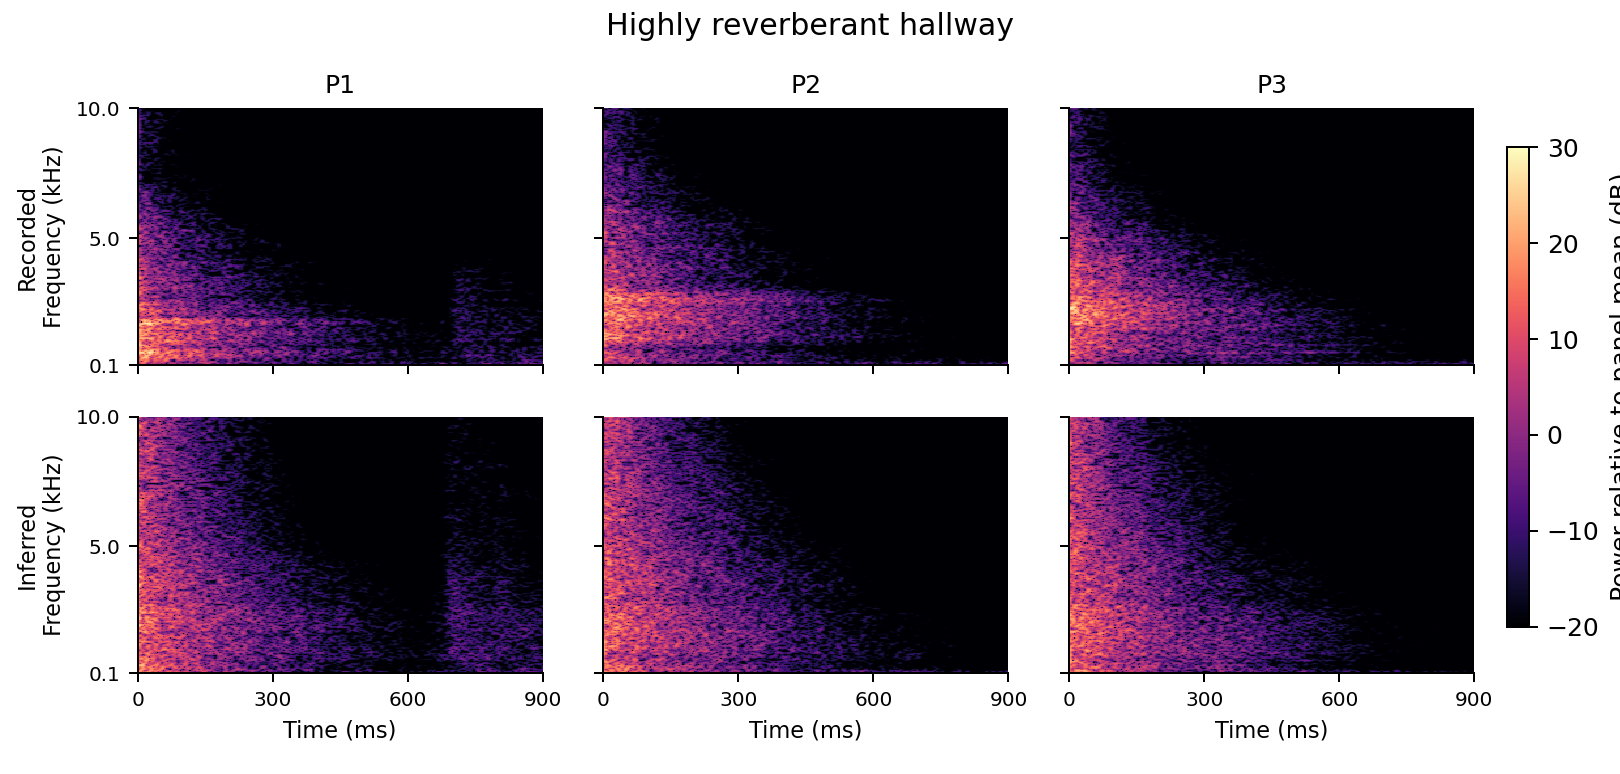
Spectrogram overview: selected P1/P2/P3 Highly reverberant hallway: recorded and inferred spectrograms for input-selected P1, P2 and P3

Top: recorded claps. Bottom: inferred RIRs. Fixed input-selected examples, 0–0.9 s and 0.1–10 kHz, with a shared color scale.

All eight modes · Room spectra

More rooms

The same input-selection rule and frozen Regression model are used for the remaining rooms. All five repetitions are available through each recording menu.

Small PC room

Small PC room

Small PC room — documented phone-recording room

P1 · repetition 1 · input-selected example

Download recording · Download inferred RIR

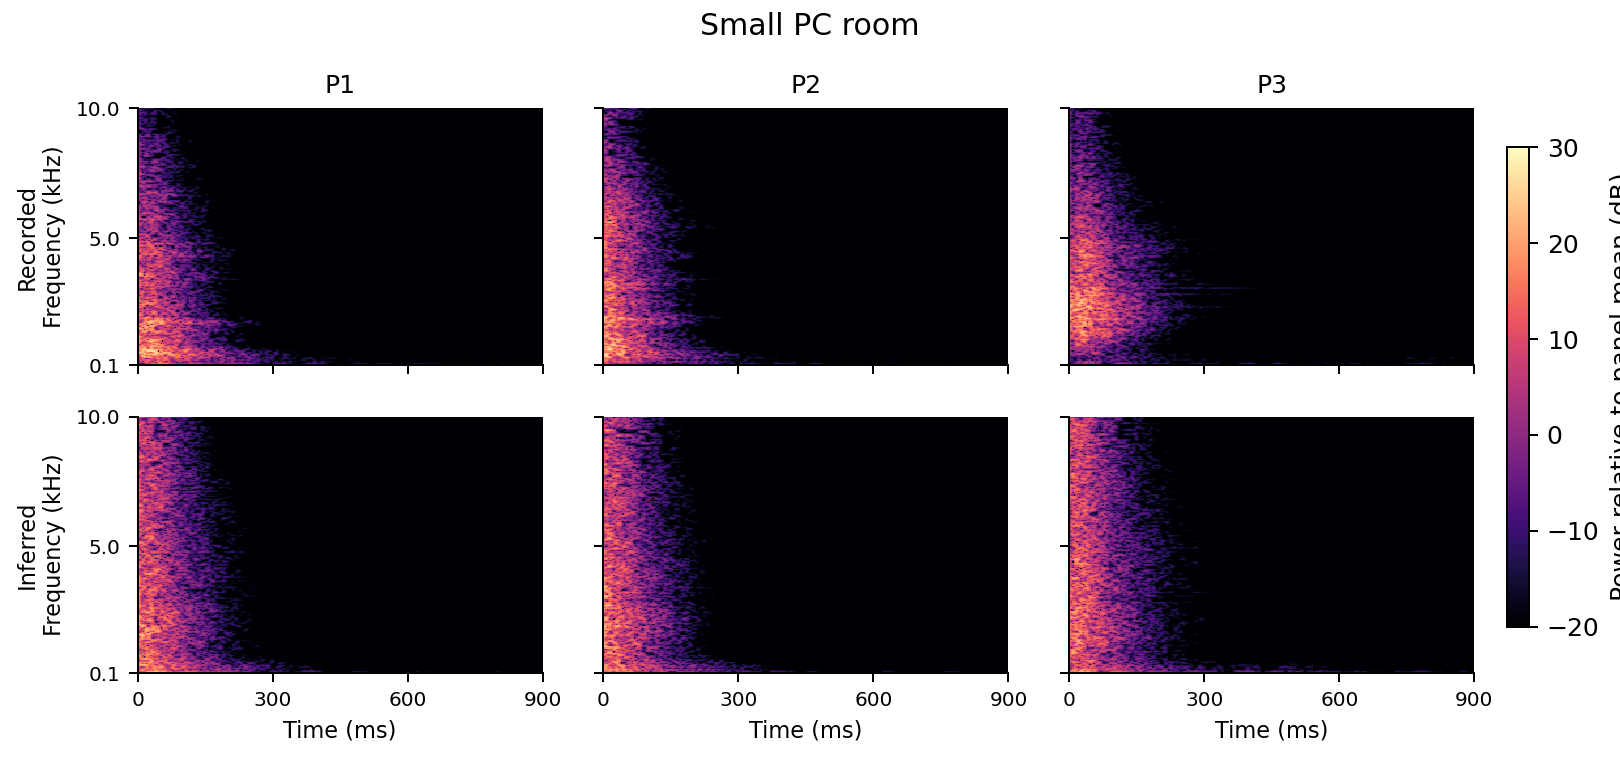
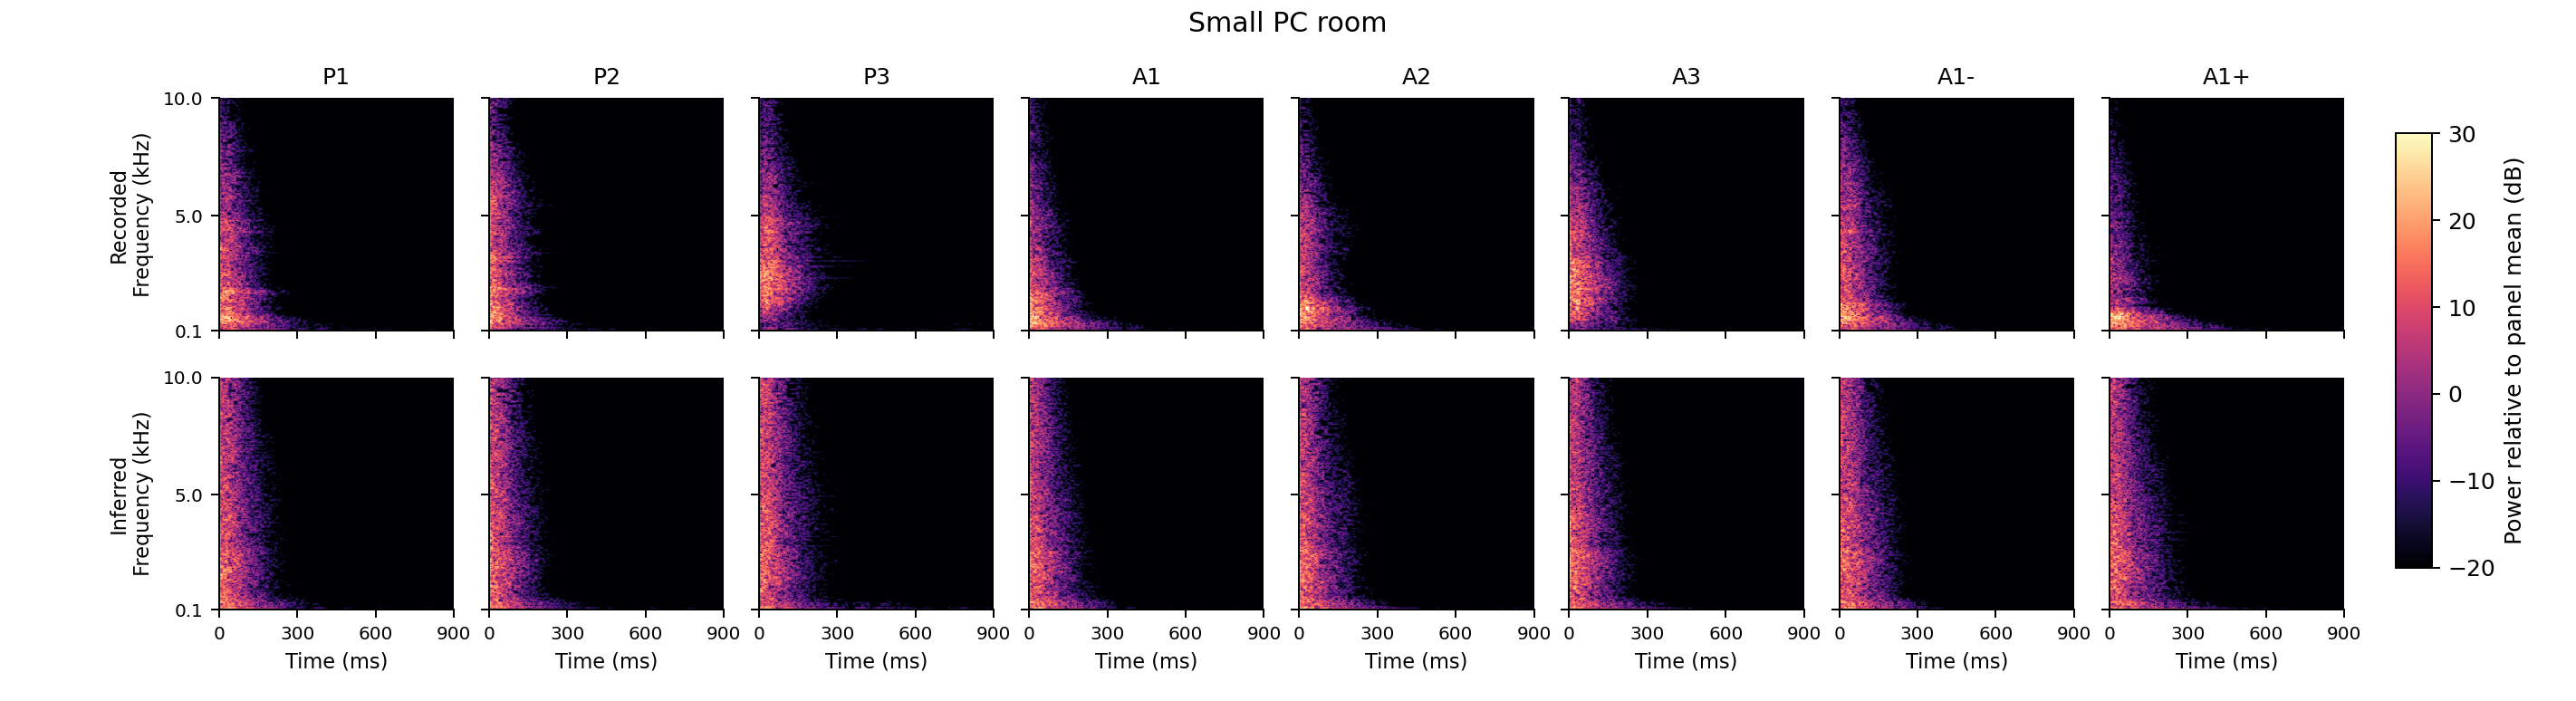
Spectrogram overview: selected P1/P2/P3 Small PC room: recorded and inferred spectrograms for input-selected P1, P2 and P3

Top: recorded claps. Bottom: inferred RIRs. Fixed input-selected examples, 0–0.9 s and 0.1–10 kHz, with a shared color scale.

All eight modes · Room spectra

Bathroom

Bathroom

Bathroom — documented phone-recording room

P1 · repetition 3 · input-selected example

Download recording · Download inferred RIR

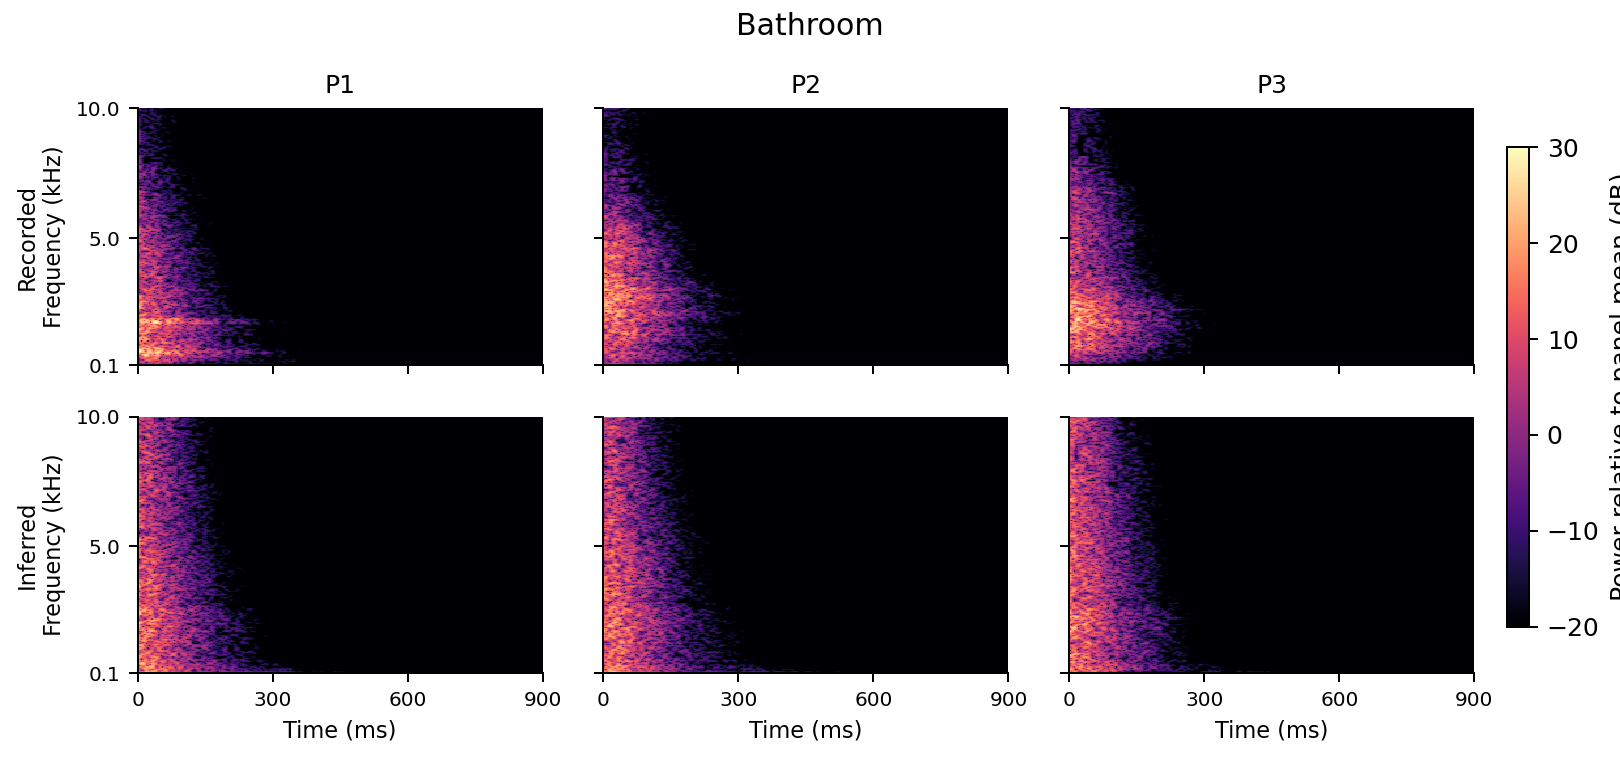
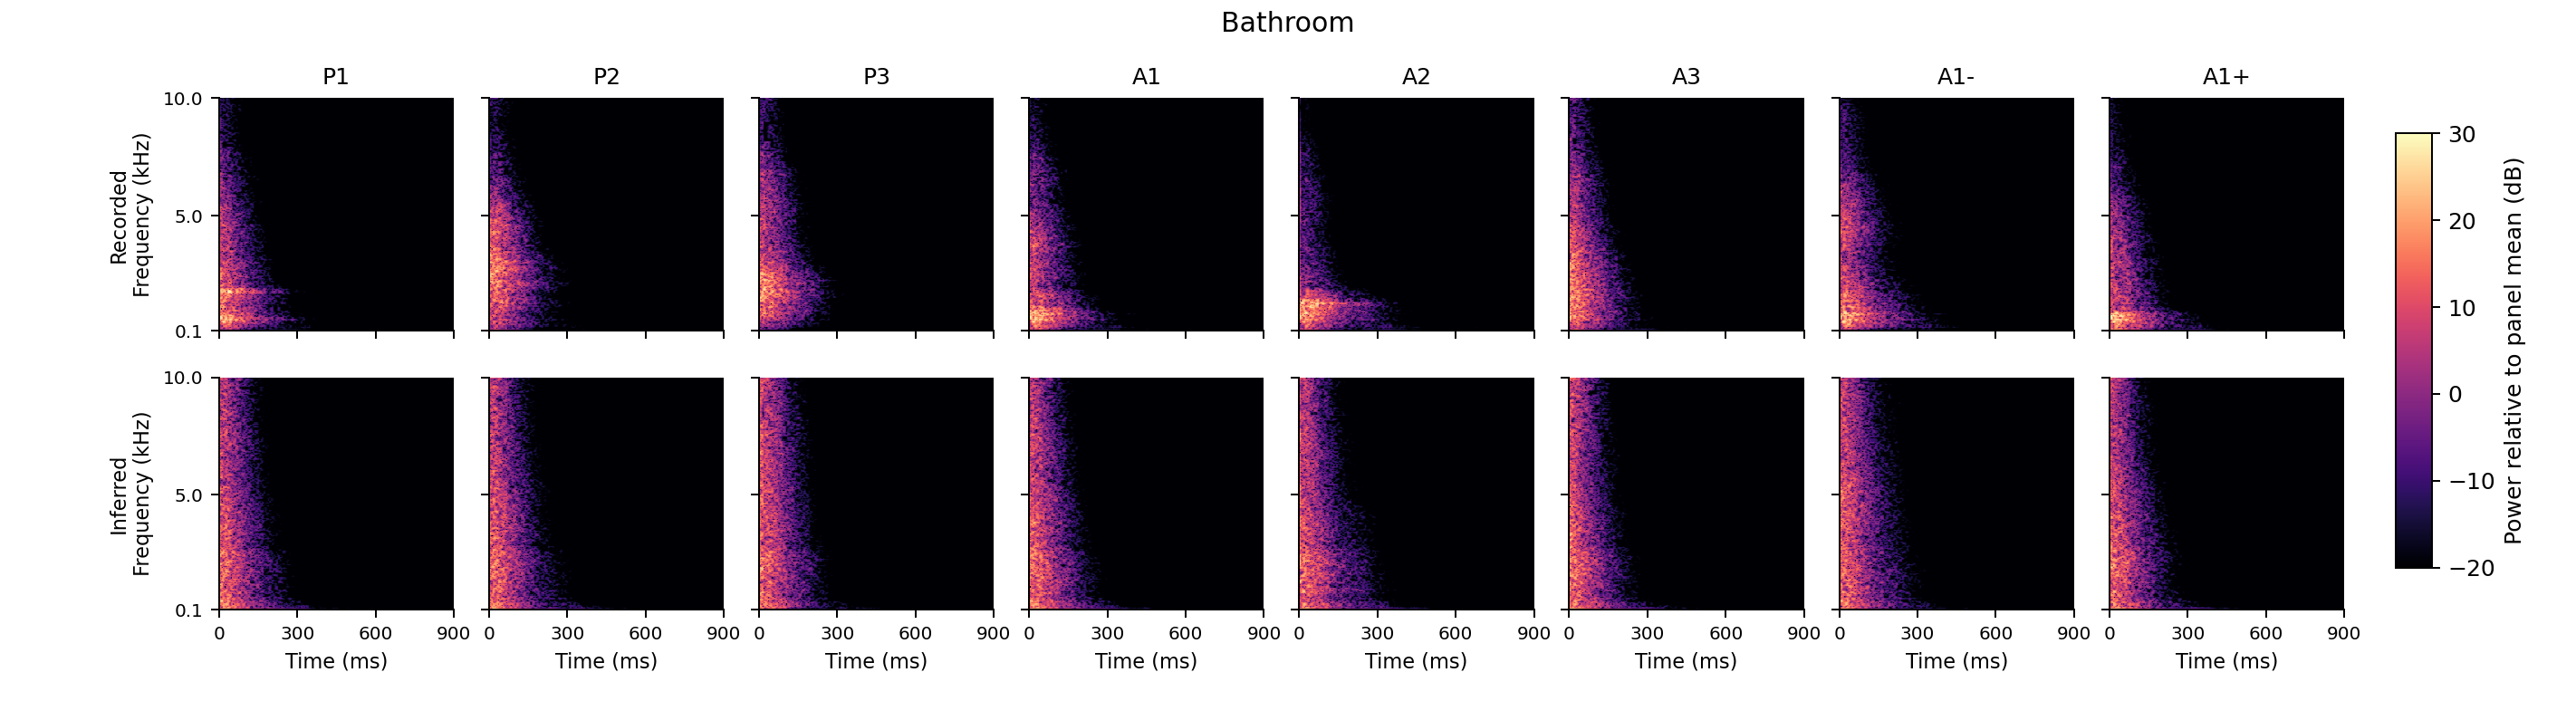
Spectrogram overview: selected P1/P2/P3 Bathroom: recorded and inferred spectrograms for input-selected P1, P2 and P3

Top: recorded claps. Bottom: inferred RIRs. Fixed input-selected examples, 0–0.9 s and 0.1–10 kHz, with a shared color scale.

All eight modes · Room spectra

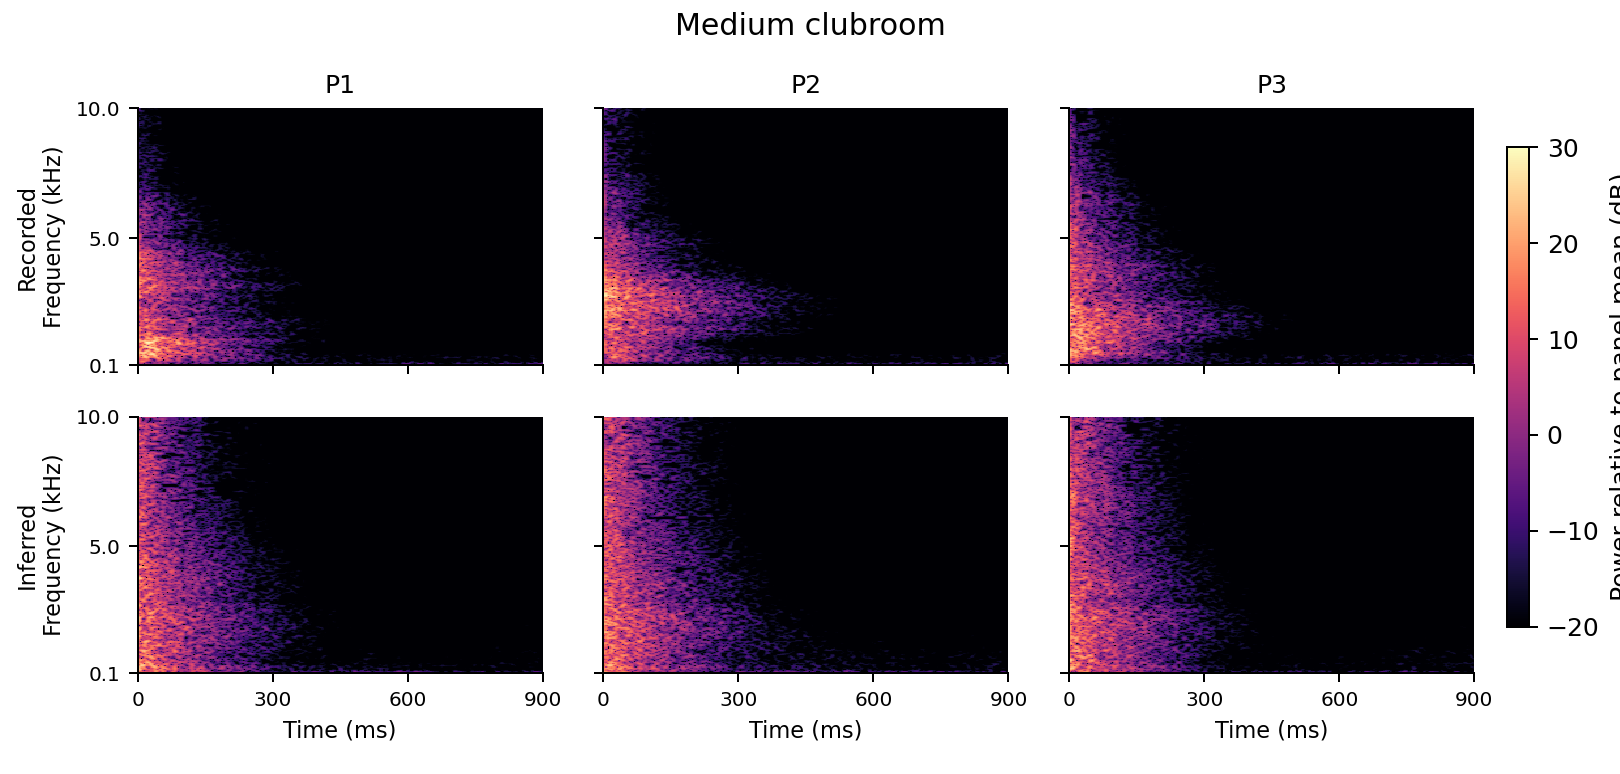
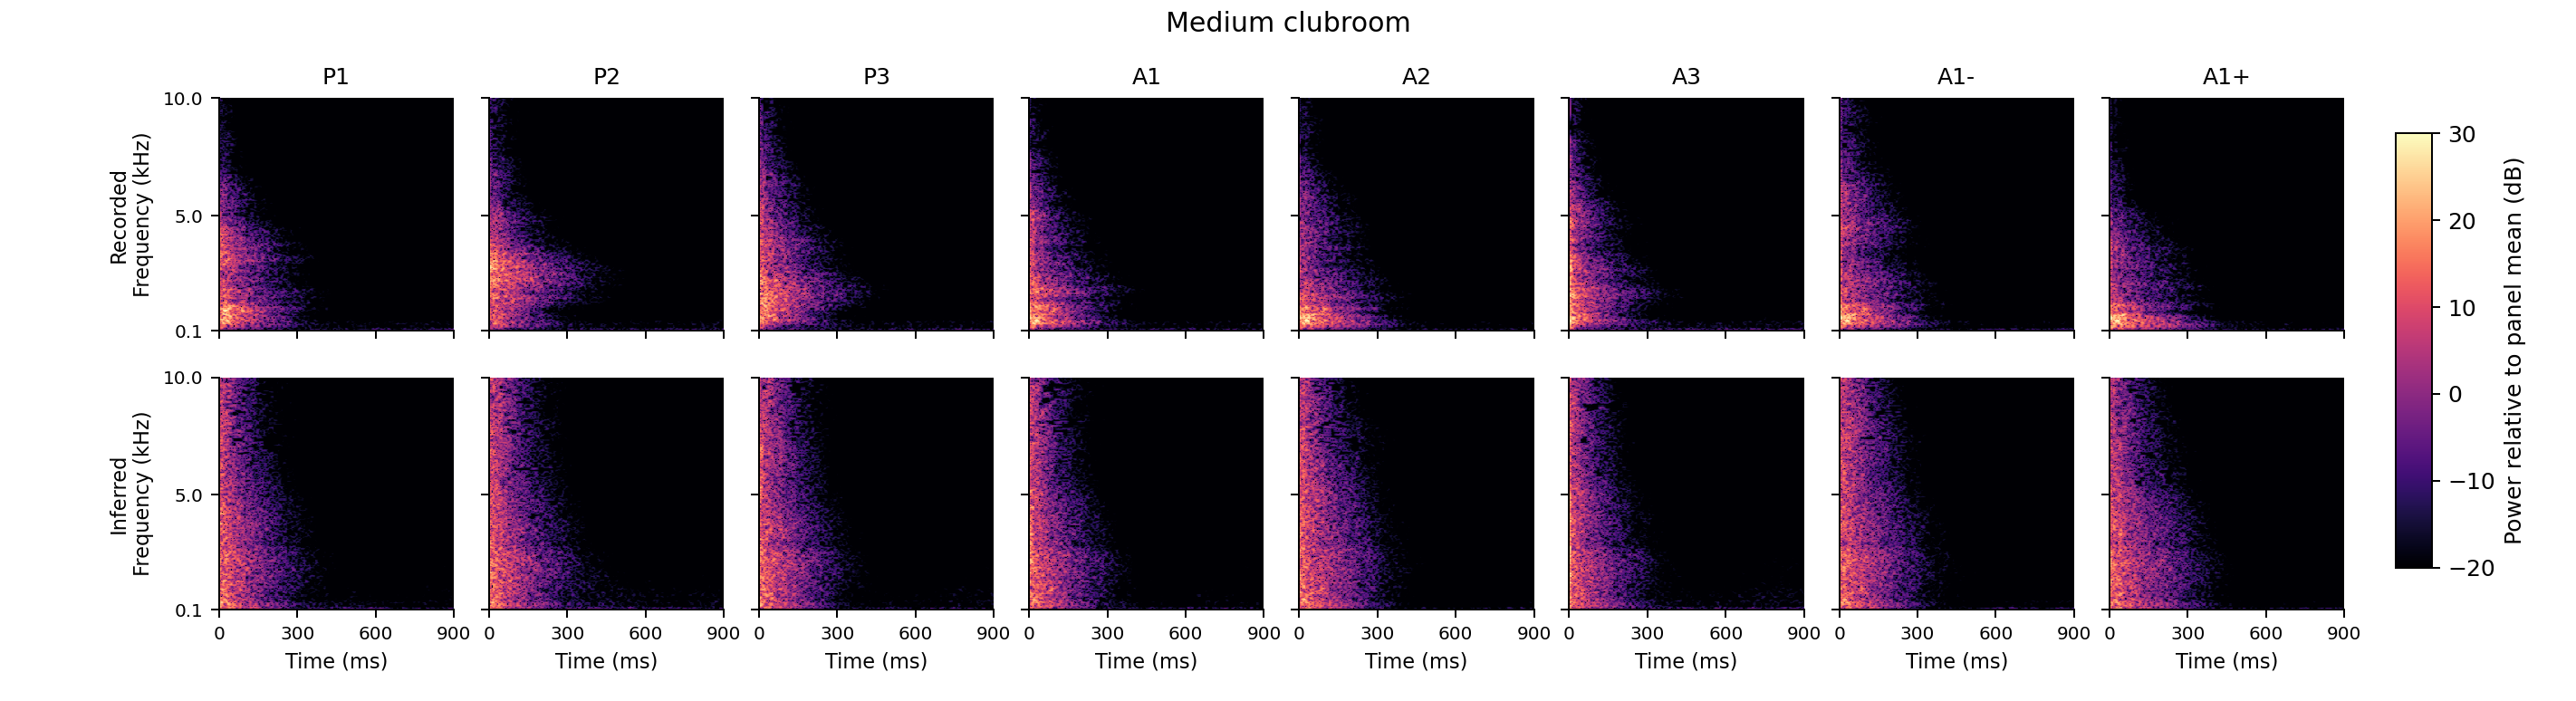
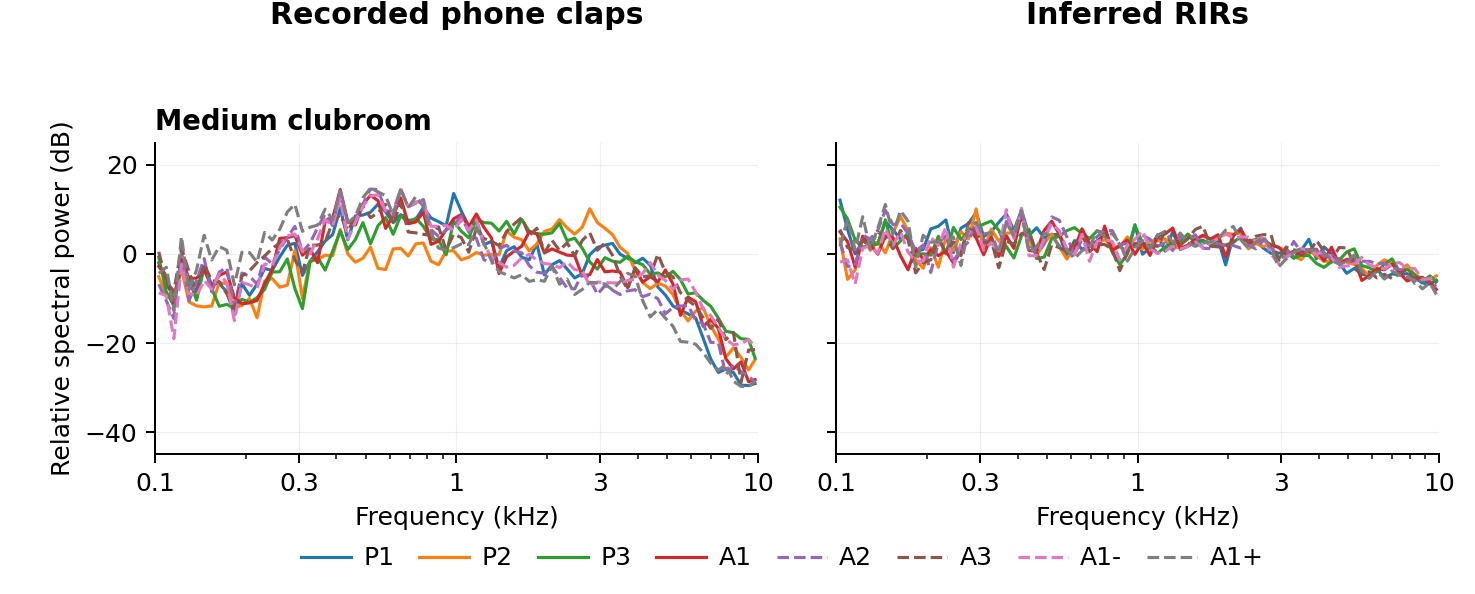
Medium clubroom

Medium clubroom

Medium clubroom — documented phone-recording room

P1 · repetition 3 · input-selected example

Download recording · Download inferred RIR

Spectrogram overview: selected P1/P2/P3 Medium clubroom: recorded and inferred spectrograms for input-selected P1, P2 and P3

Top: recorded claps. Bottom: inferred RIRs. Fixed input-selected examples, 0–0.9 s and 0.1–10 kHz, with a shared color scale.

All eight modes · Room spectra

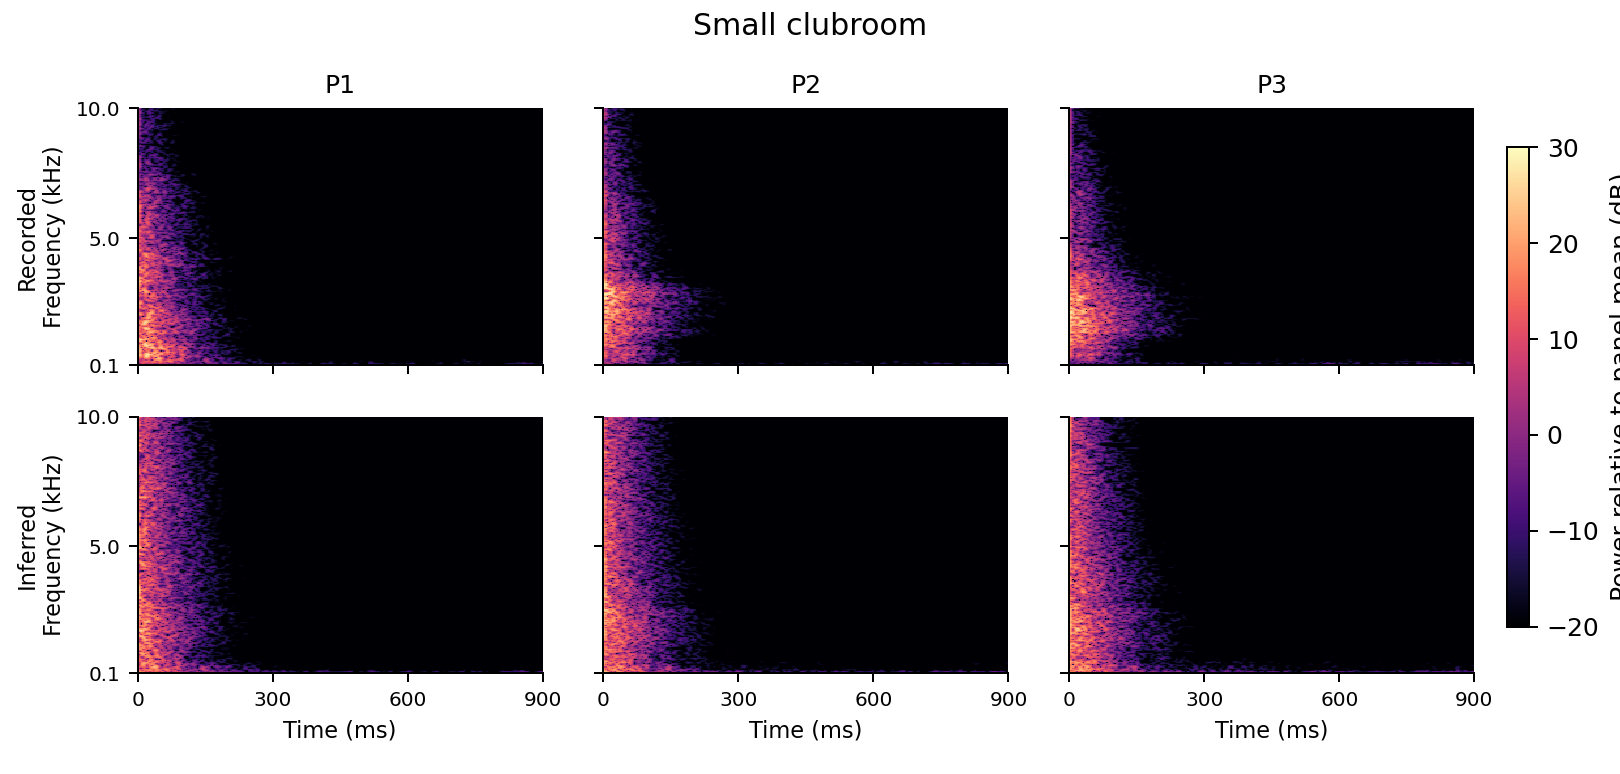
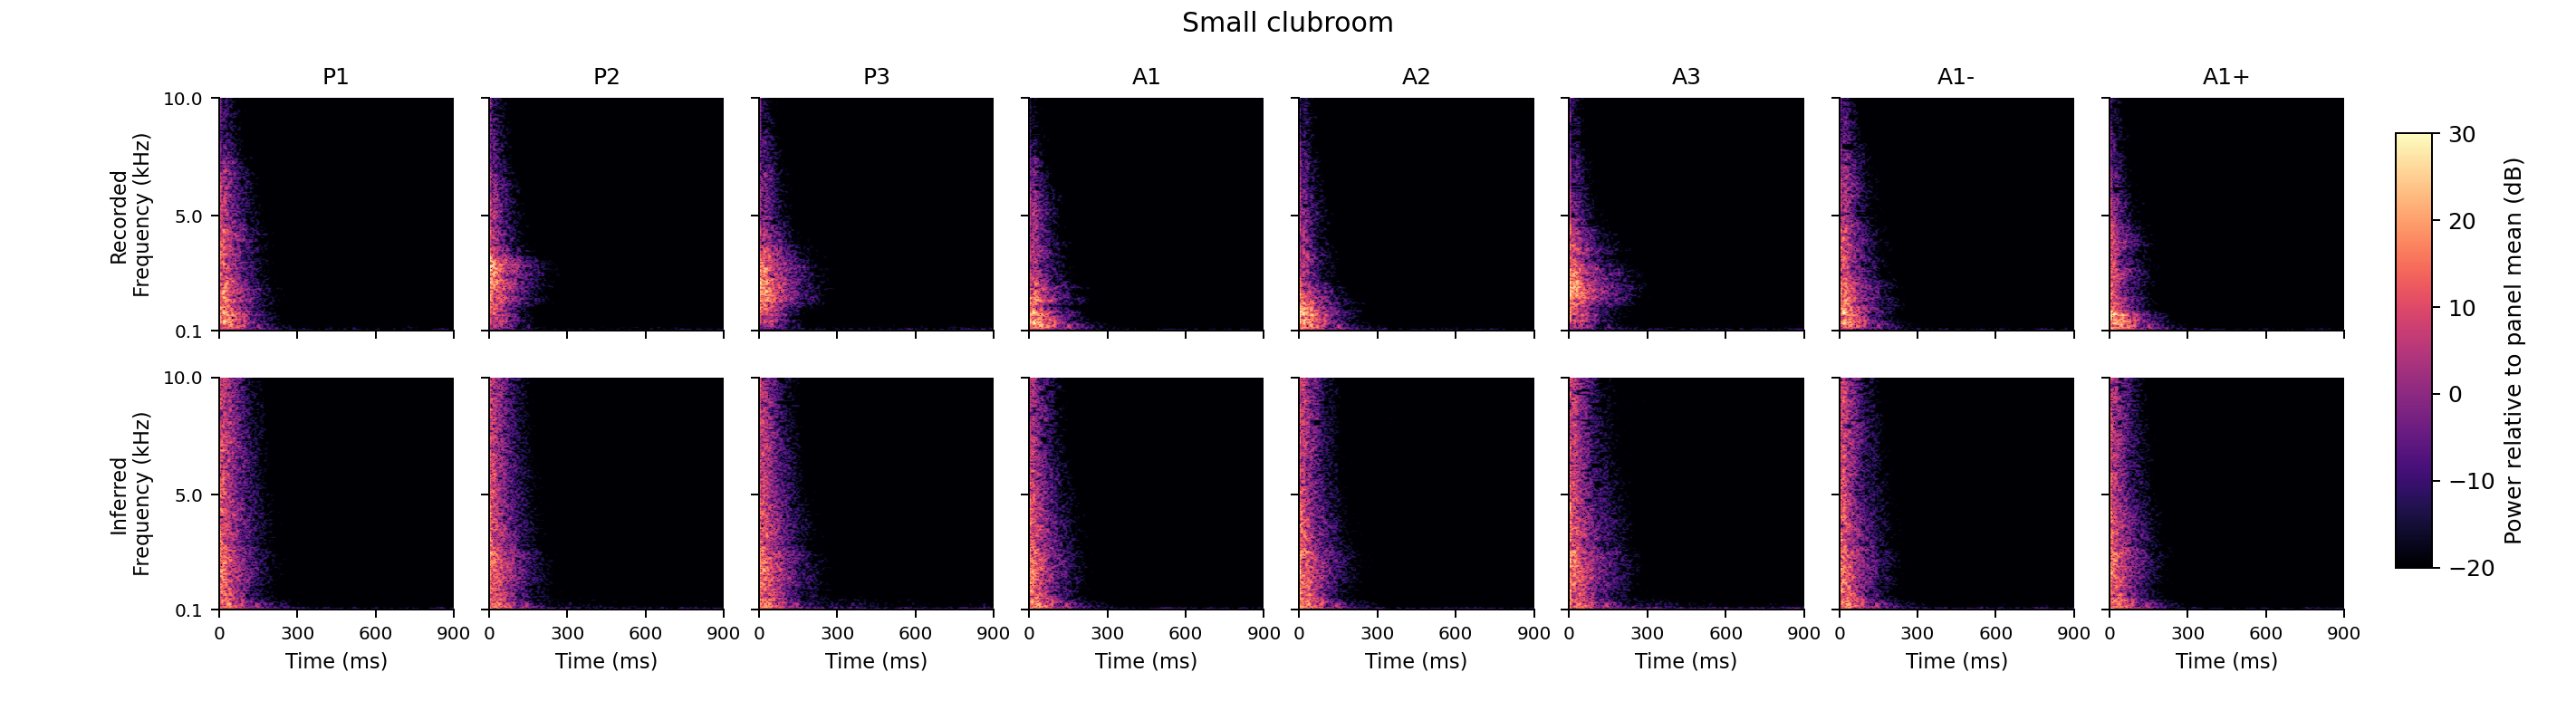
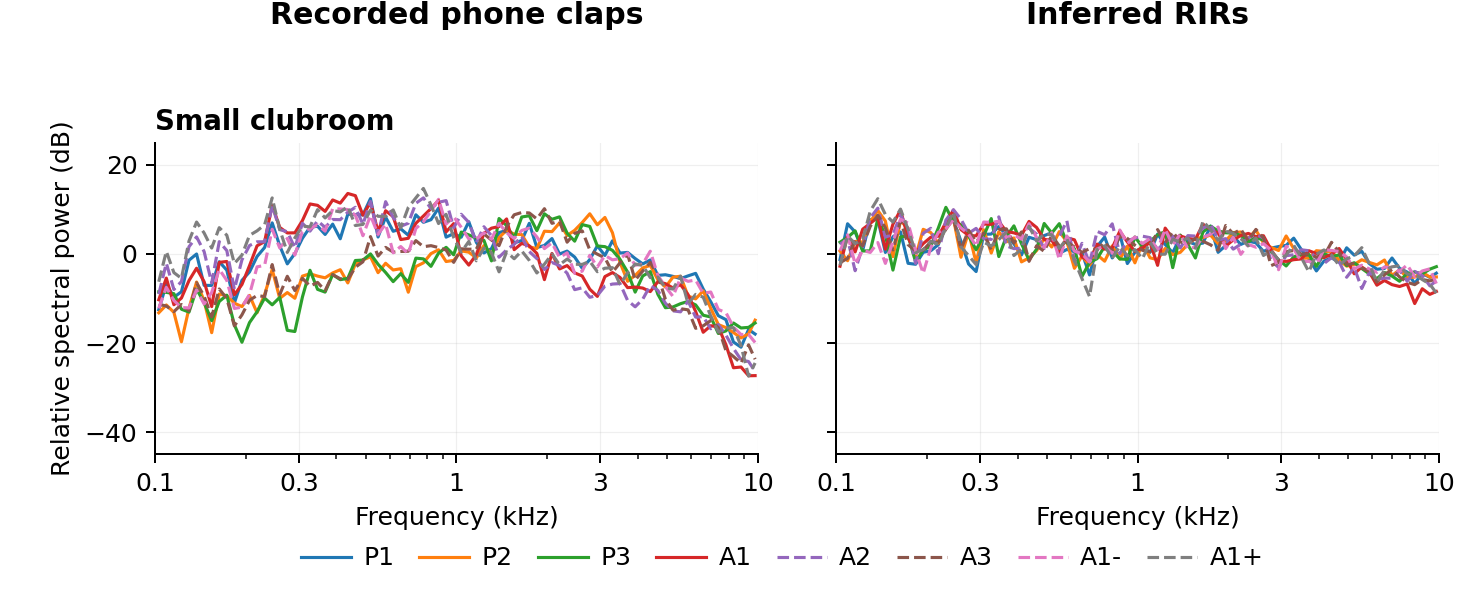
Small clubroom

Small clubroom

Small clubroom — documented phone-recording room

P1 · repetition 3 · input-selected example

Download recording · Download inferred RIR

Spectrogram overview: selected P1/P2/P3 Small clubroom: recorded and inferred spectrograms for input-selected P1, P2 and P3

Top: recorded claps. Bottom: inferred RIRs. Fixed input-selected examples, 0–0.9 s and 0.1–10 kHz, with a shared color scale.

All eight modes · Room spectra

Elevator

Elevator

Elevator — documented phone-recording room

P1 · repetition 5 · input-selected example

Download recording · Download inferred RIR

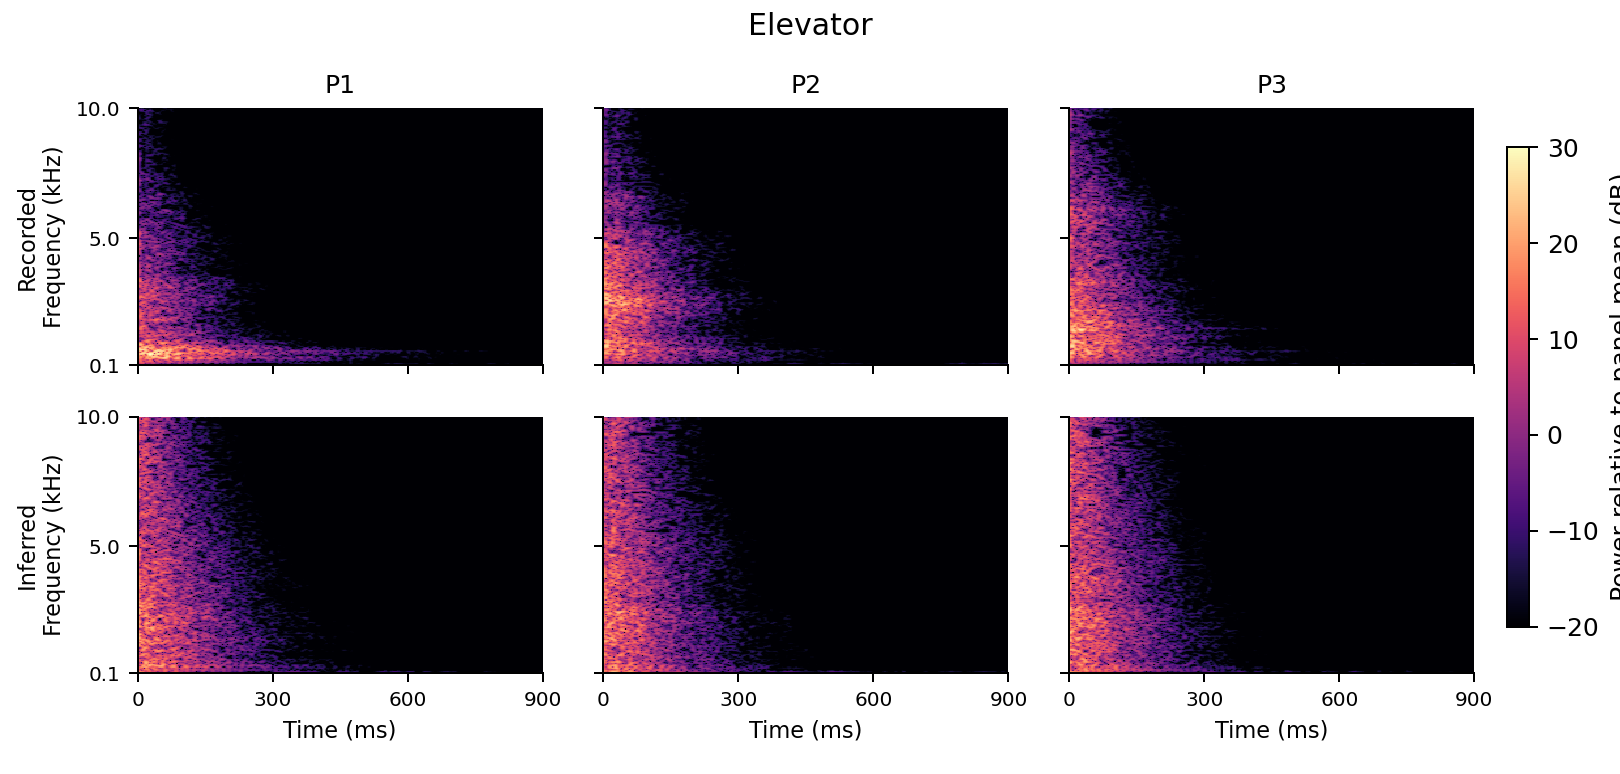
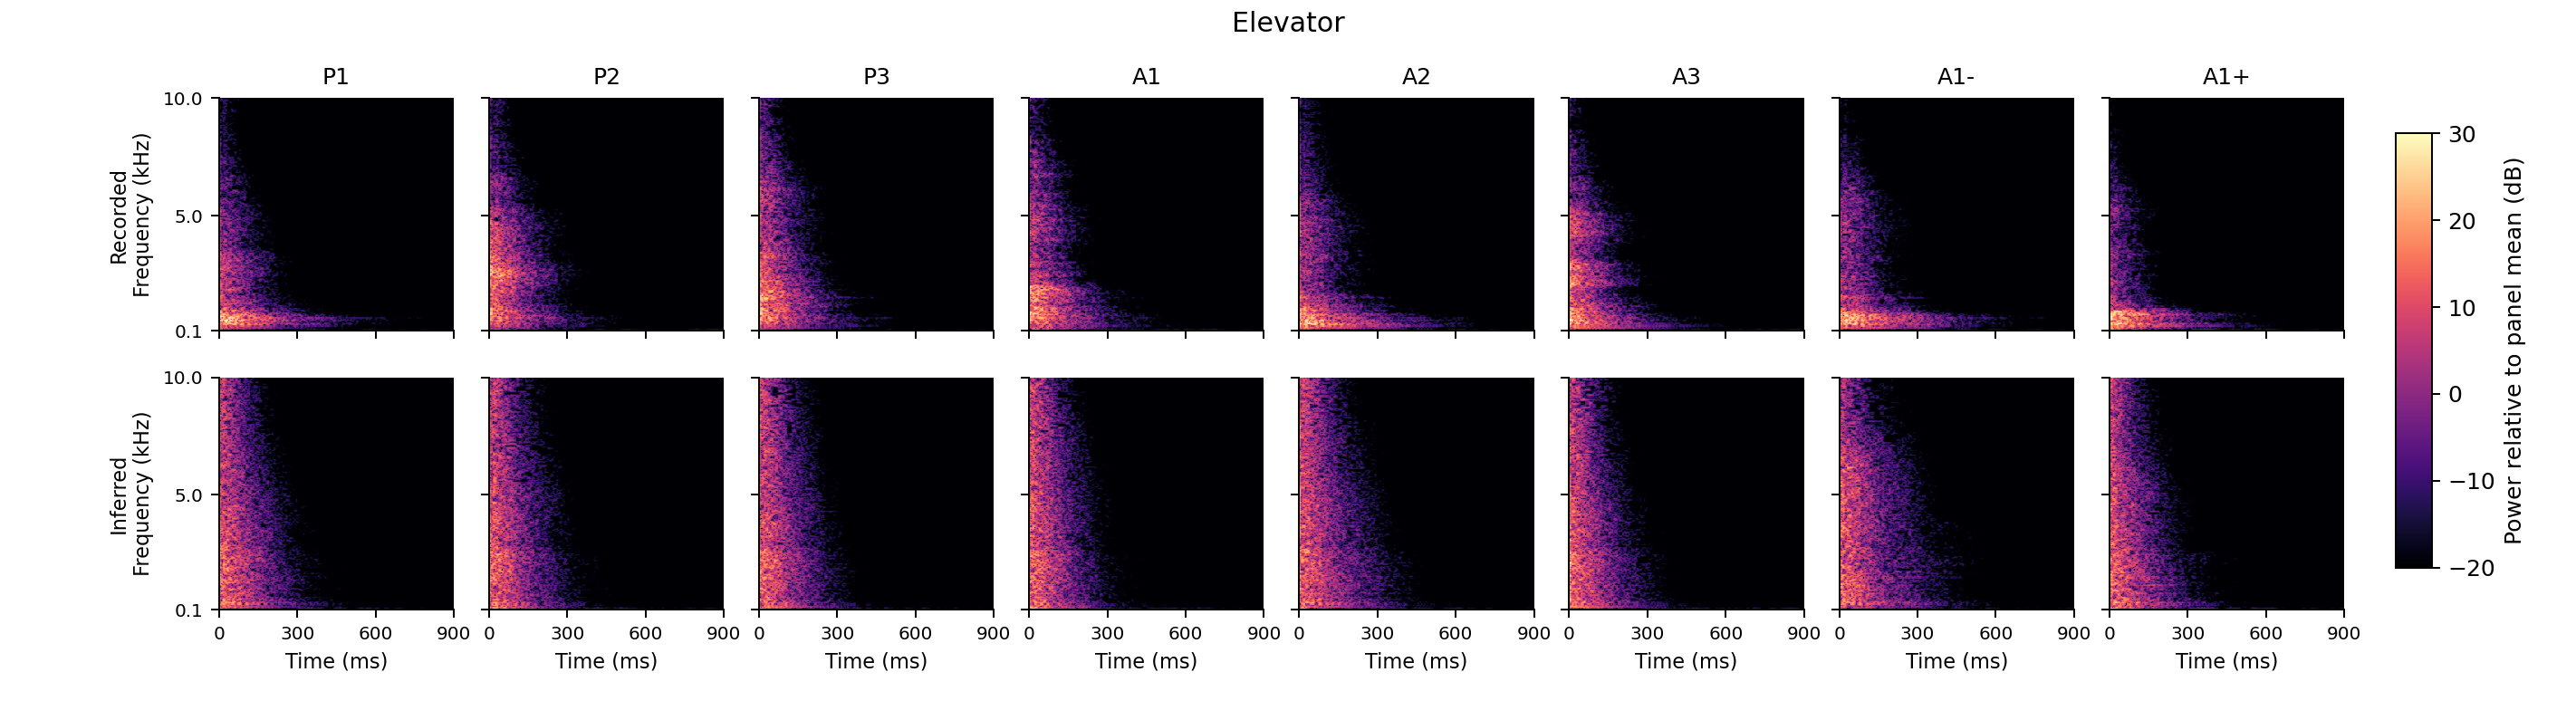
Spectrogram overview: selected P1/P2/P3 Elevator: recorded and inferred spectrograms for input-selected P1, P2 and P3

Top: recorded claps. Bottom: inferred RIRs. Fixed input-selected examples, 0–0.9 s and 0.1–10 kHz, with a shared color scale.

All eight modes · Room spectra

Spectrograms and temporal structure

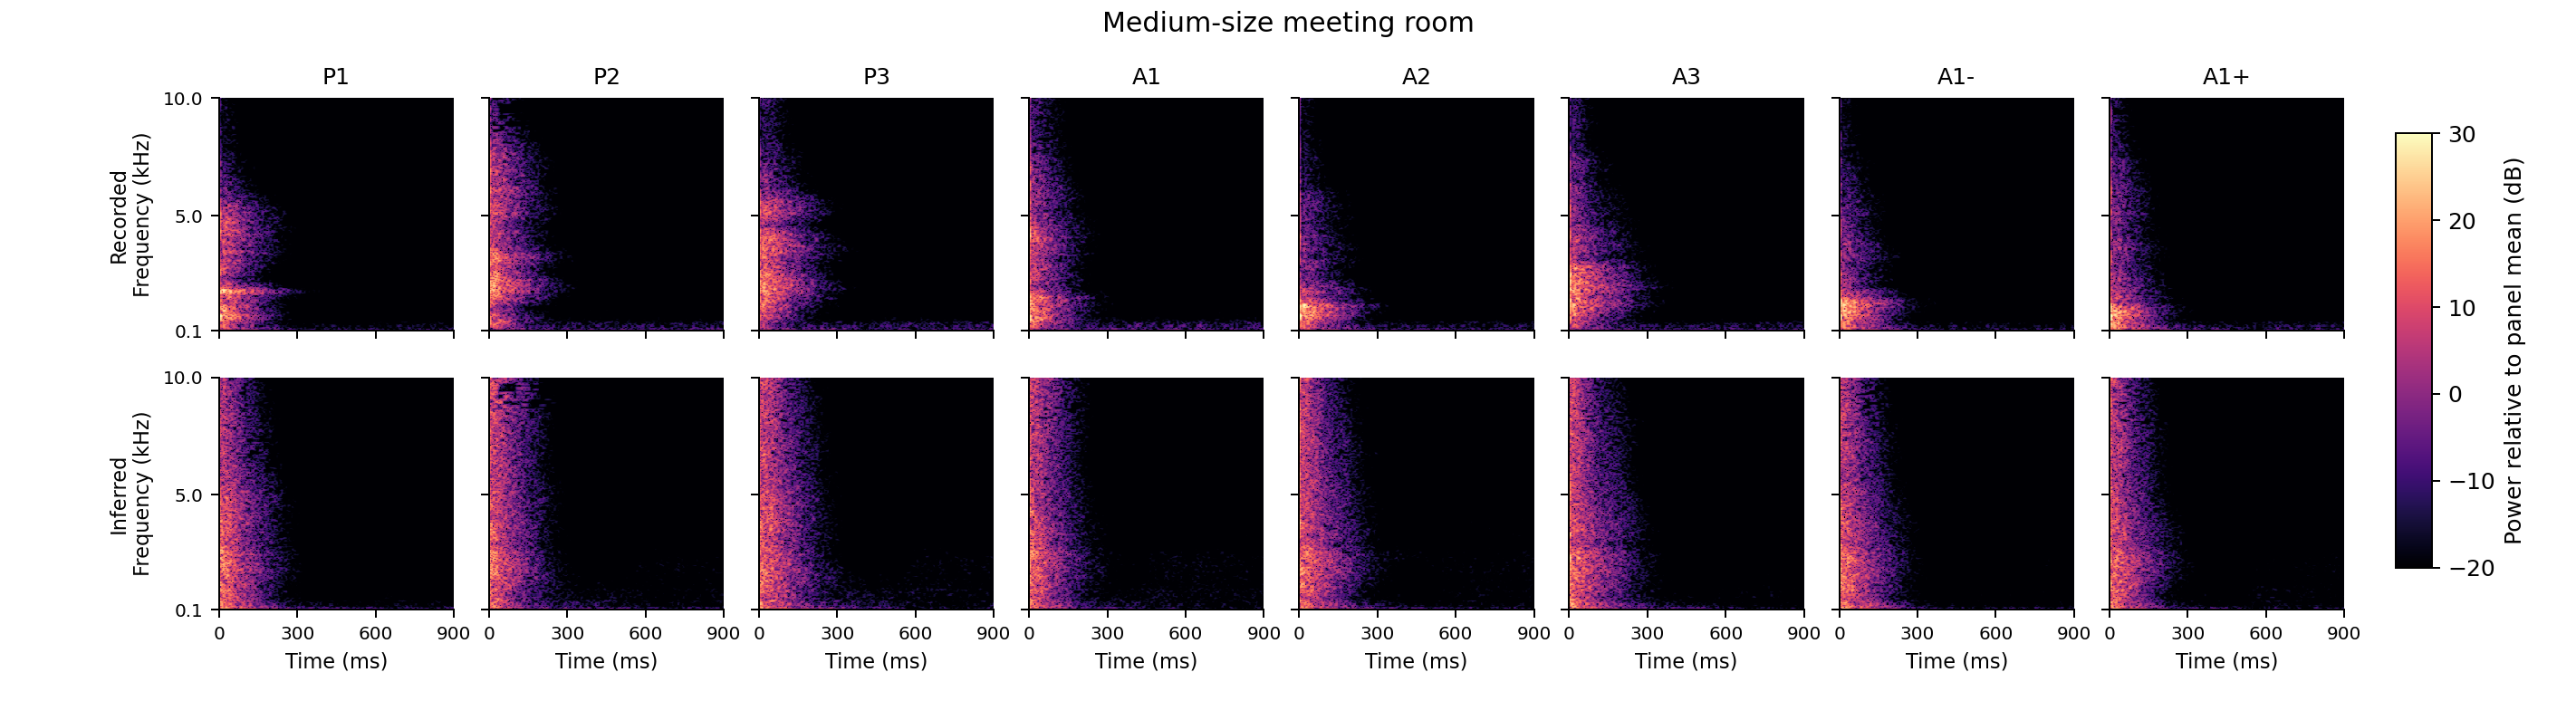
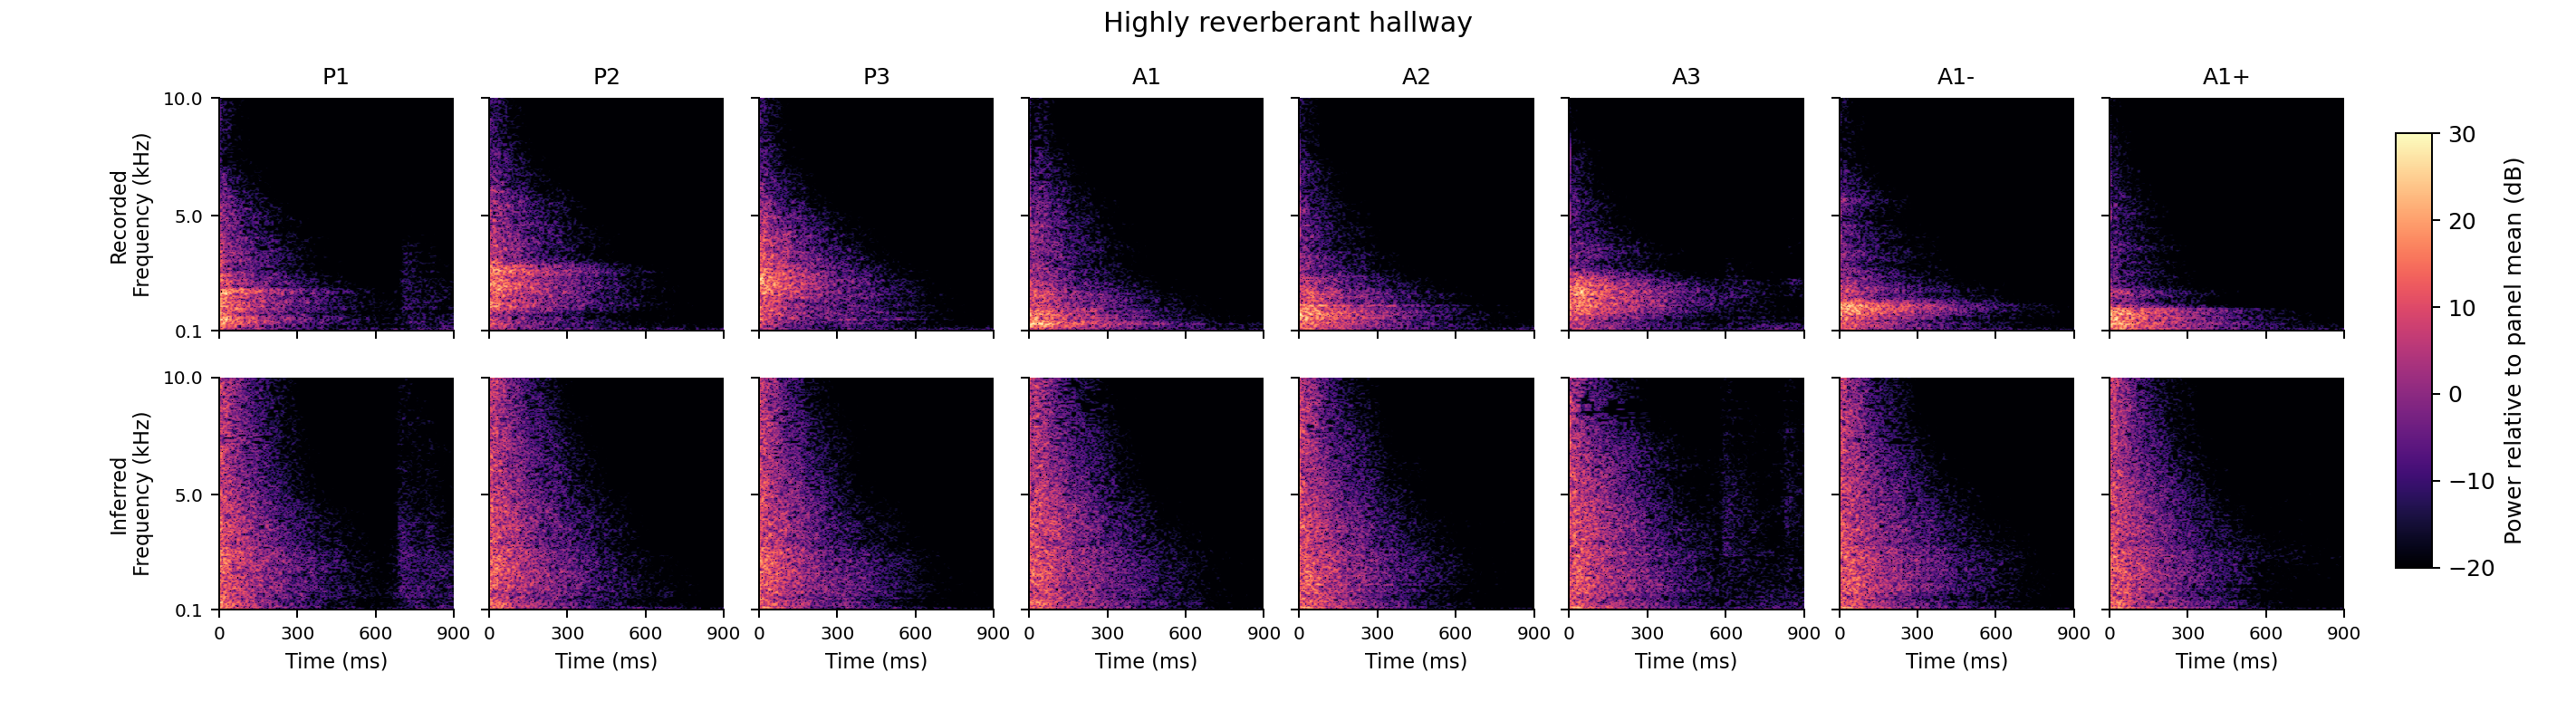
Expand the figures below to inspect the same input-selected examples. Spectrogram power is normalized by each panel’s mean and displayed with one shared −20 to +30 dB scale.

Medium-size meeting room

Spectrograms (P1/P2/P3) Medium-size meeting room P1/P2/P3 recorded and inferred spectrograms

Eight-mode PDF

Highly reverberant hallway

Spectrograms (P1/P2/P3) Highly reverberant hallway P1/P2/P3 recorded and inferred spectrograms

Eight-mode PDF

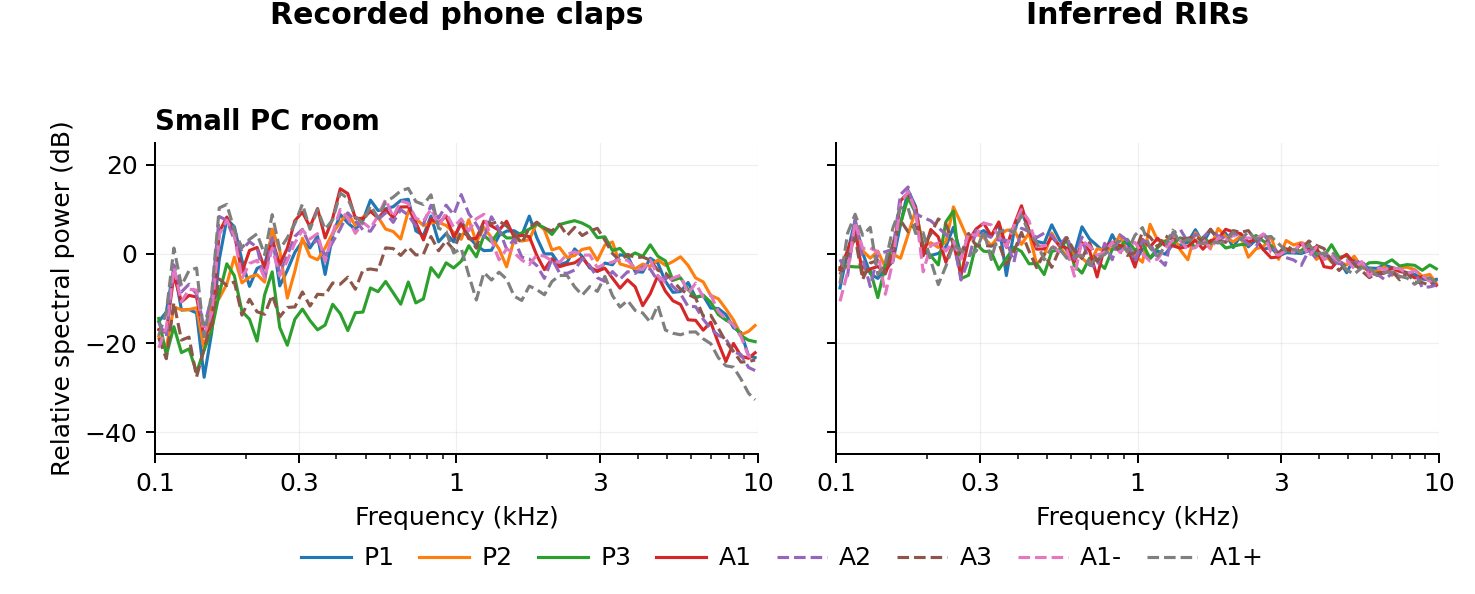
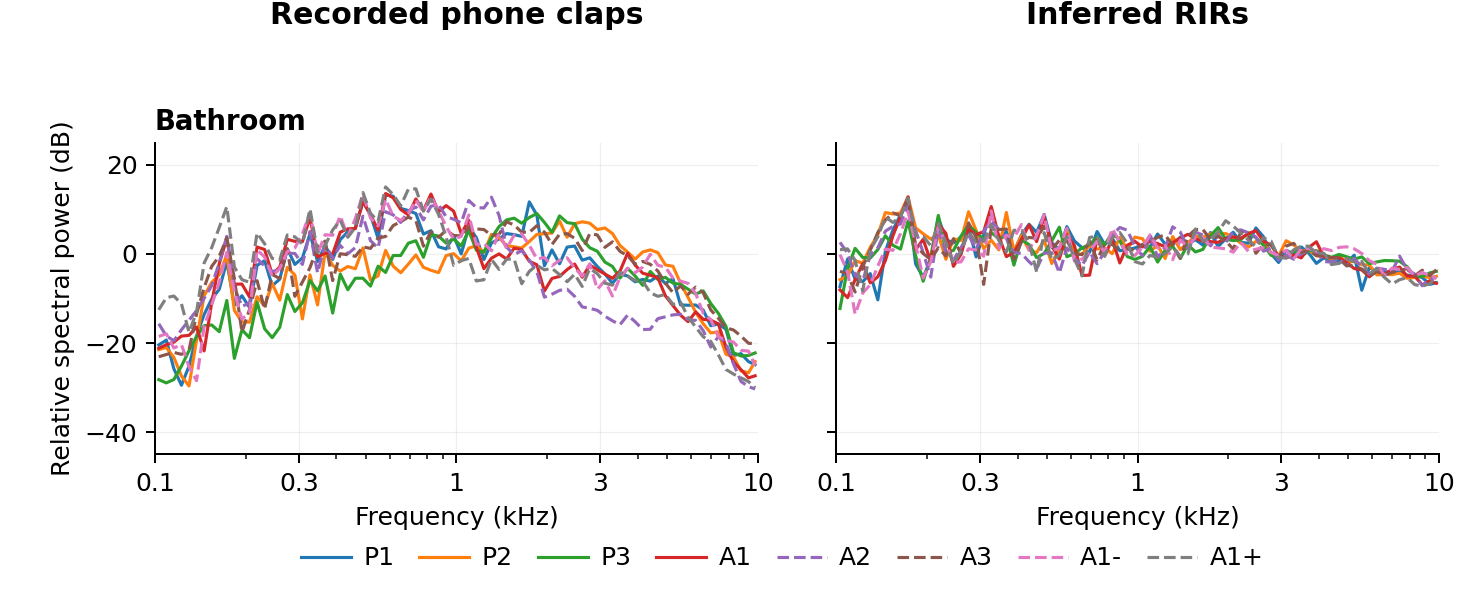
Spectra and temporal RMS envelopes Eight-mode spectra and RMS temporal envelopes of recorded claps and inferred RIRs, grouped by room

The temporal panels show 0–500 ms RMS envelopes, with a 5 ms window and approximately 1 ms spacing. They use the original digital levels without peak normalization, with shared −70 to 0 dB limits and digital full scale equal to one for every curve. The 500 ms window replaces an earlier 250 ms crop, which ended while the reverberant hallway was still only about 19 dB into its decay.

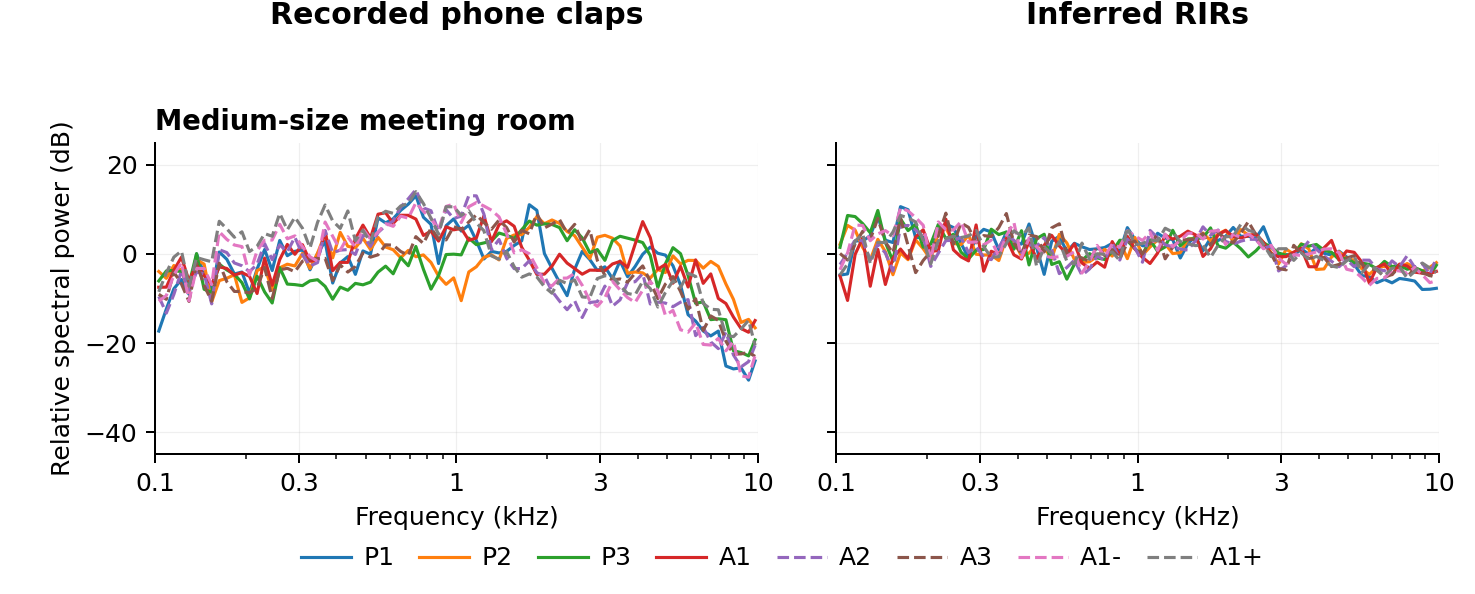
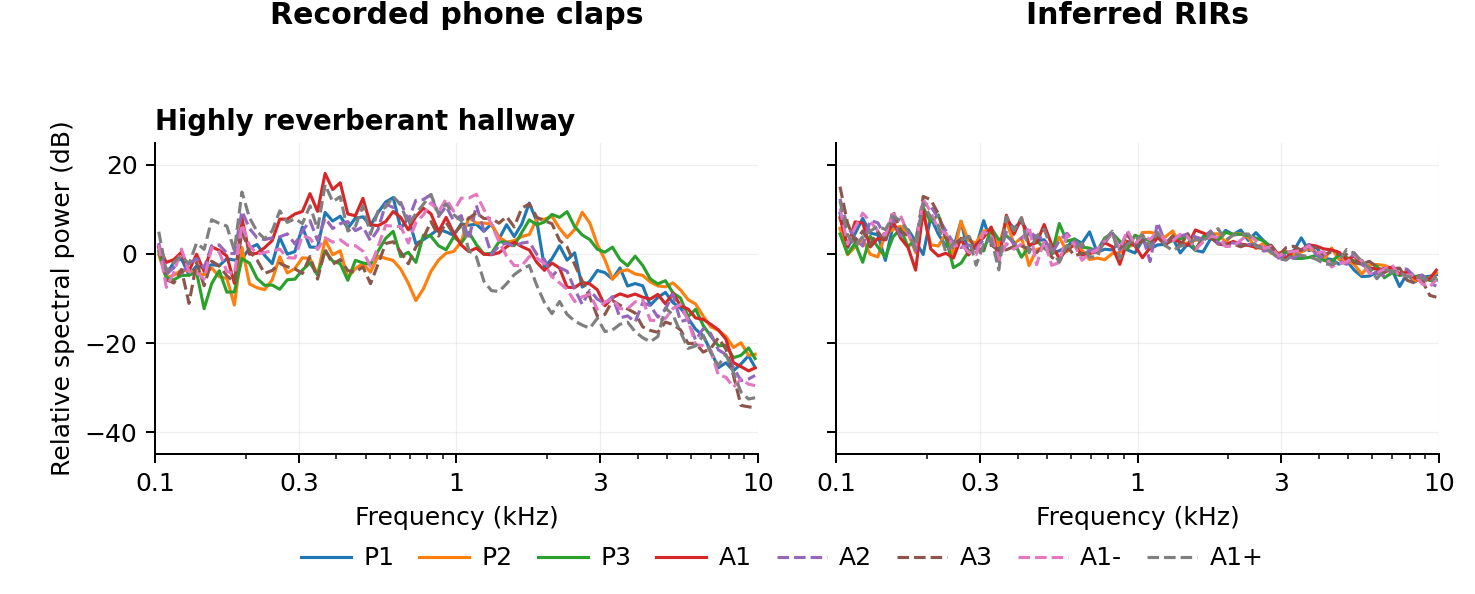
These combined figures use 0.1–15 kHz spectra from the first 0.9 s, with 1/12-octave power averaging and the original per-signal mean FFT-bin power normalization over 0.1–10 kHz. All spectral panels share −40 to +20 dB limits. Only the temporal panels use unnormalized digital amplitudes; these are not calibrated sound-pressure levels.

Paper spectra, 15 kHz · RMS envelopes (dB) · Raw linear waveforms

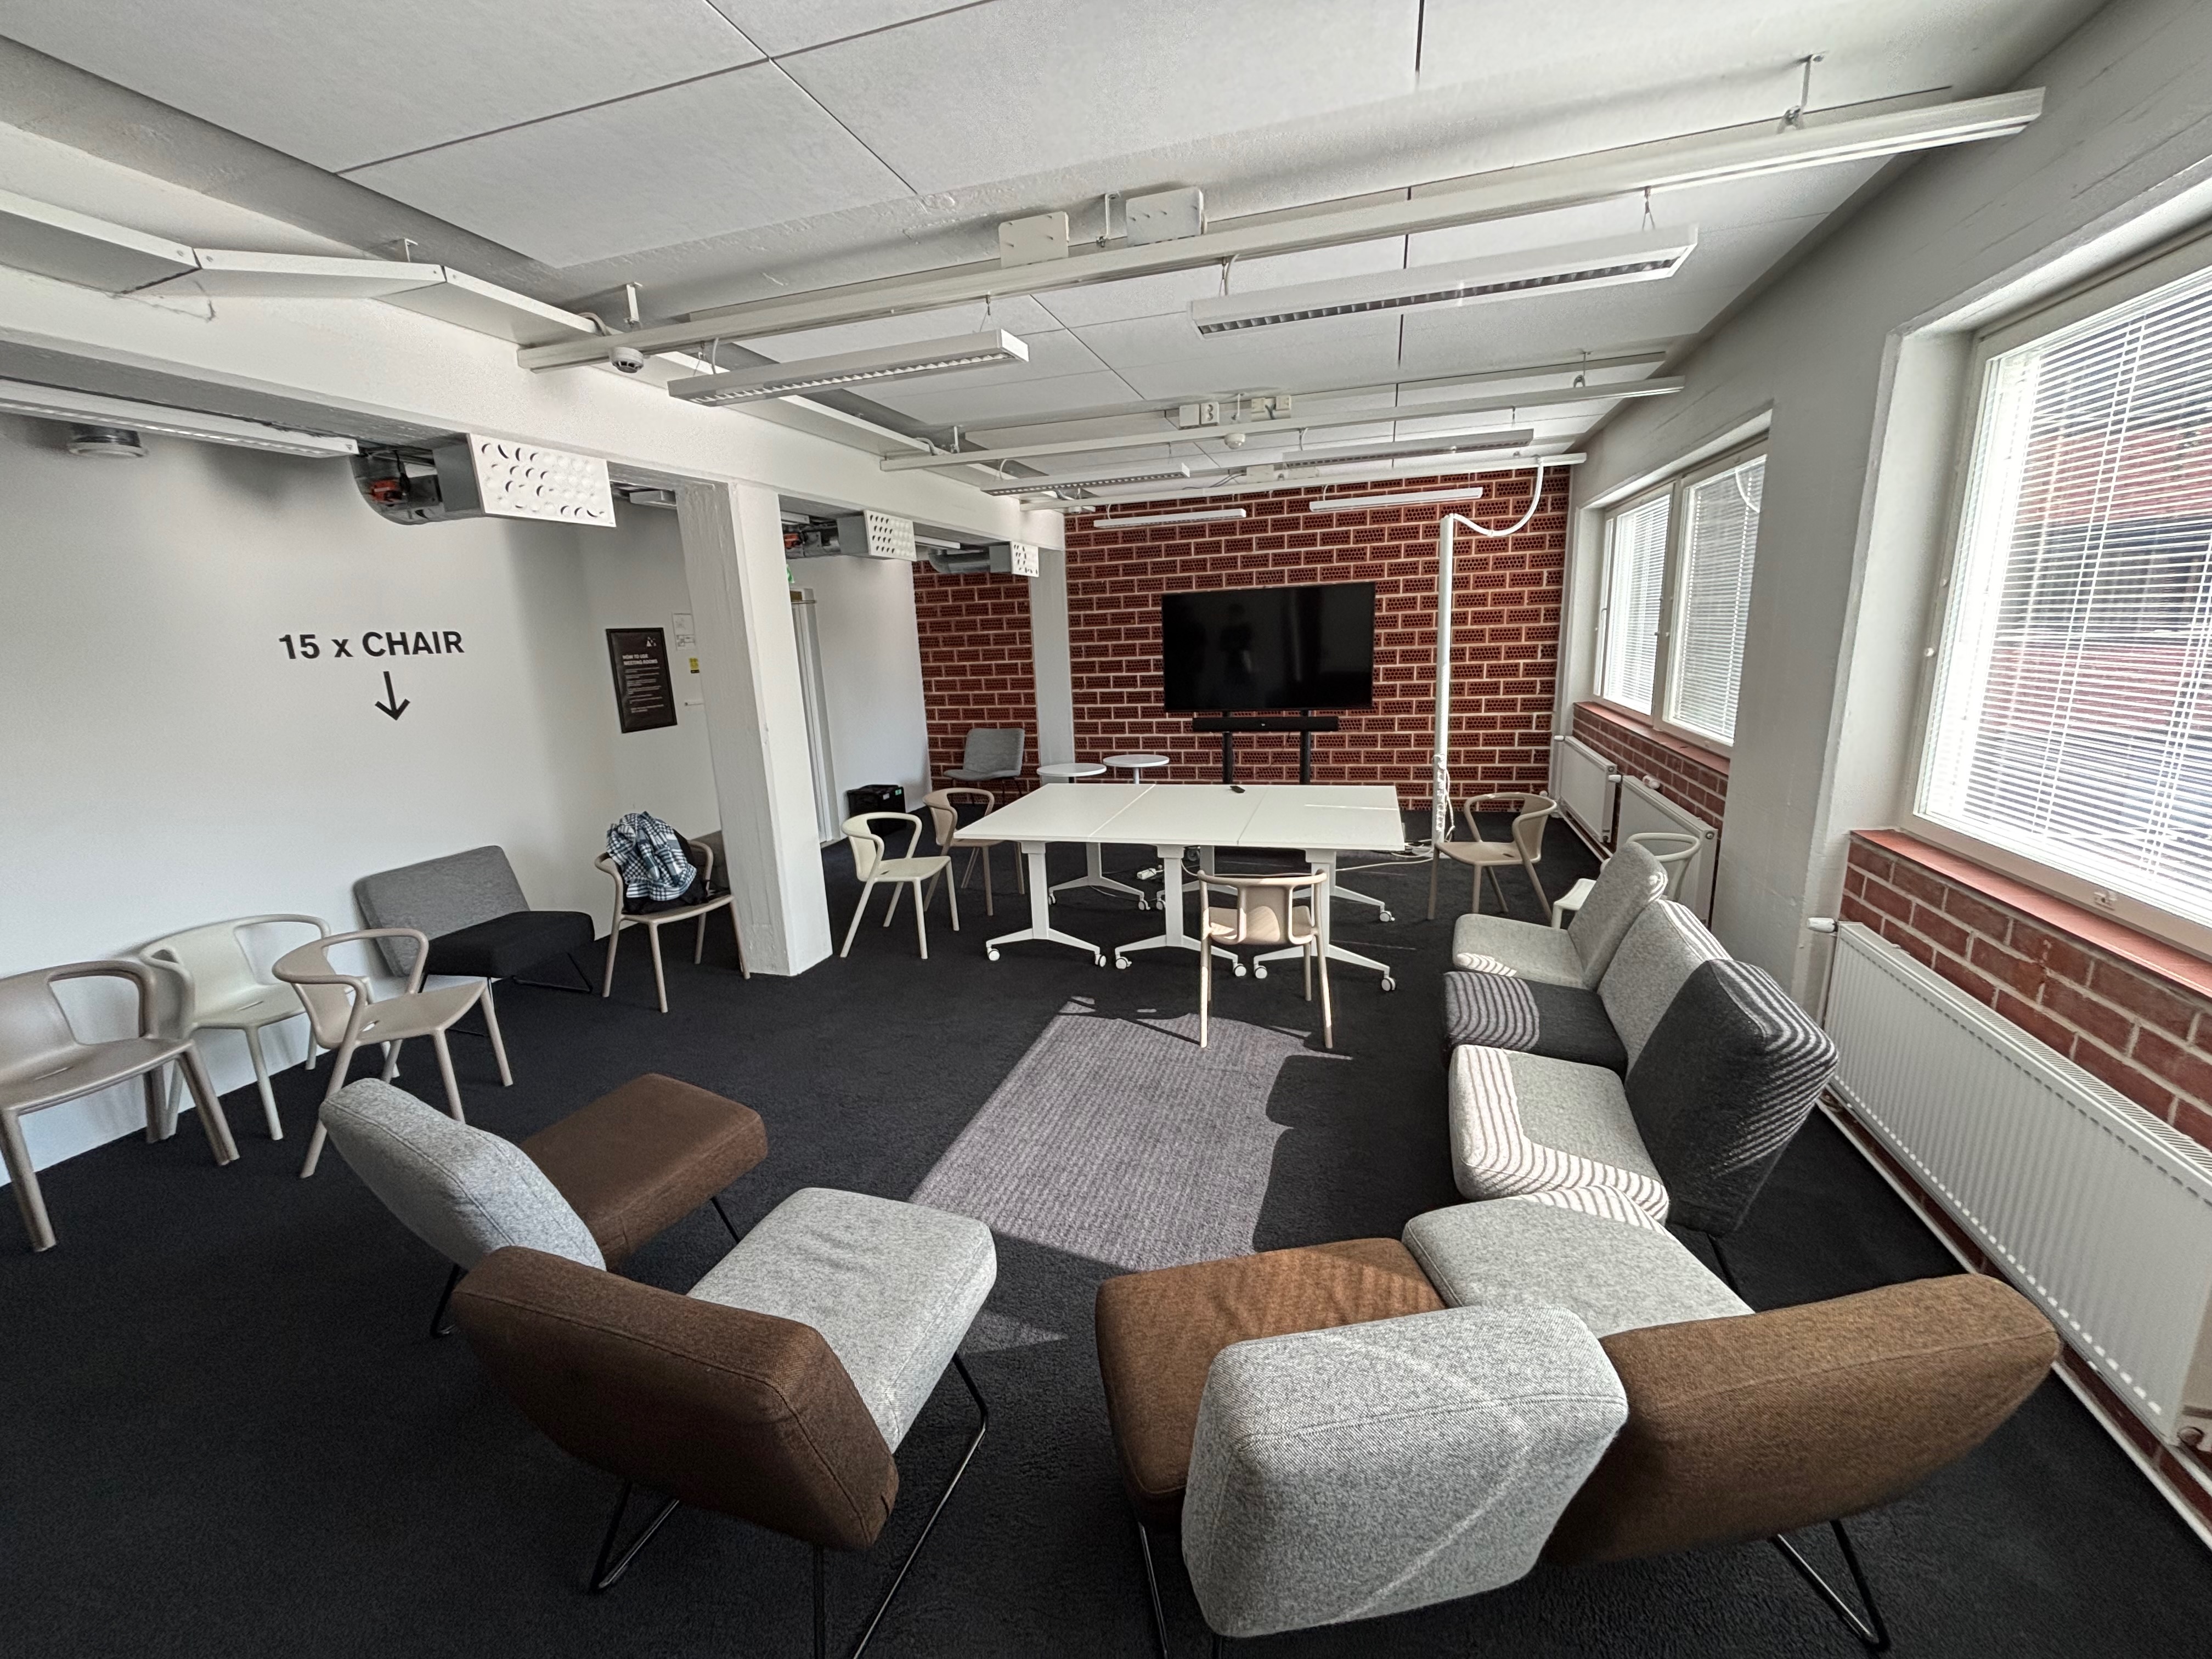
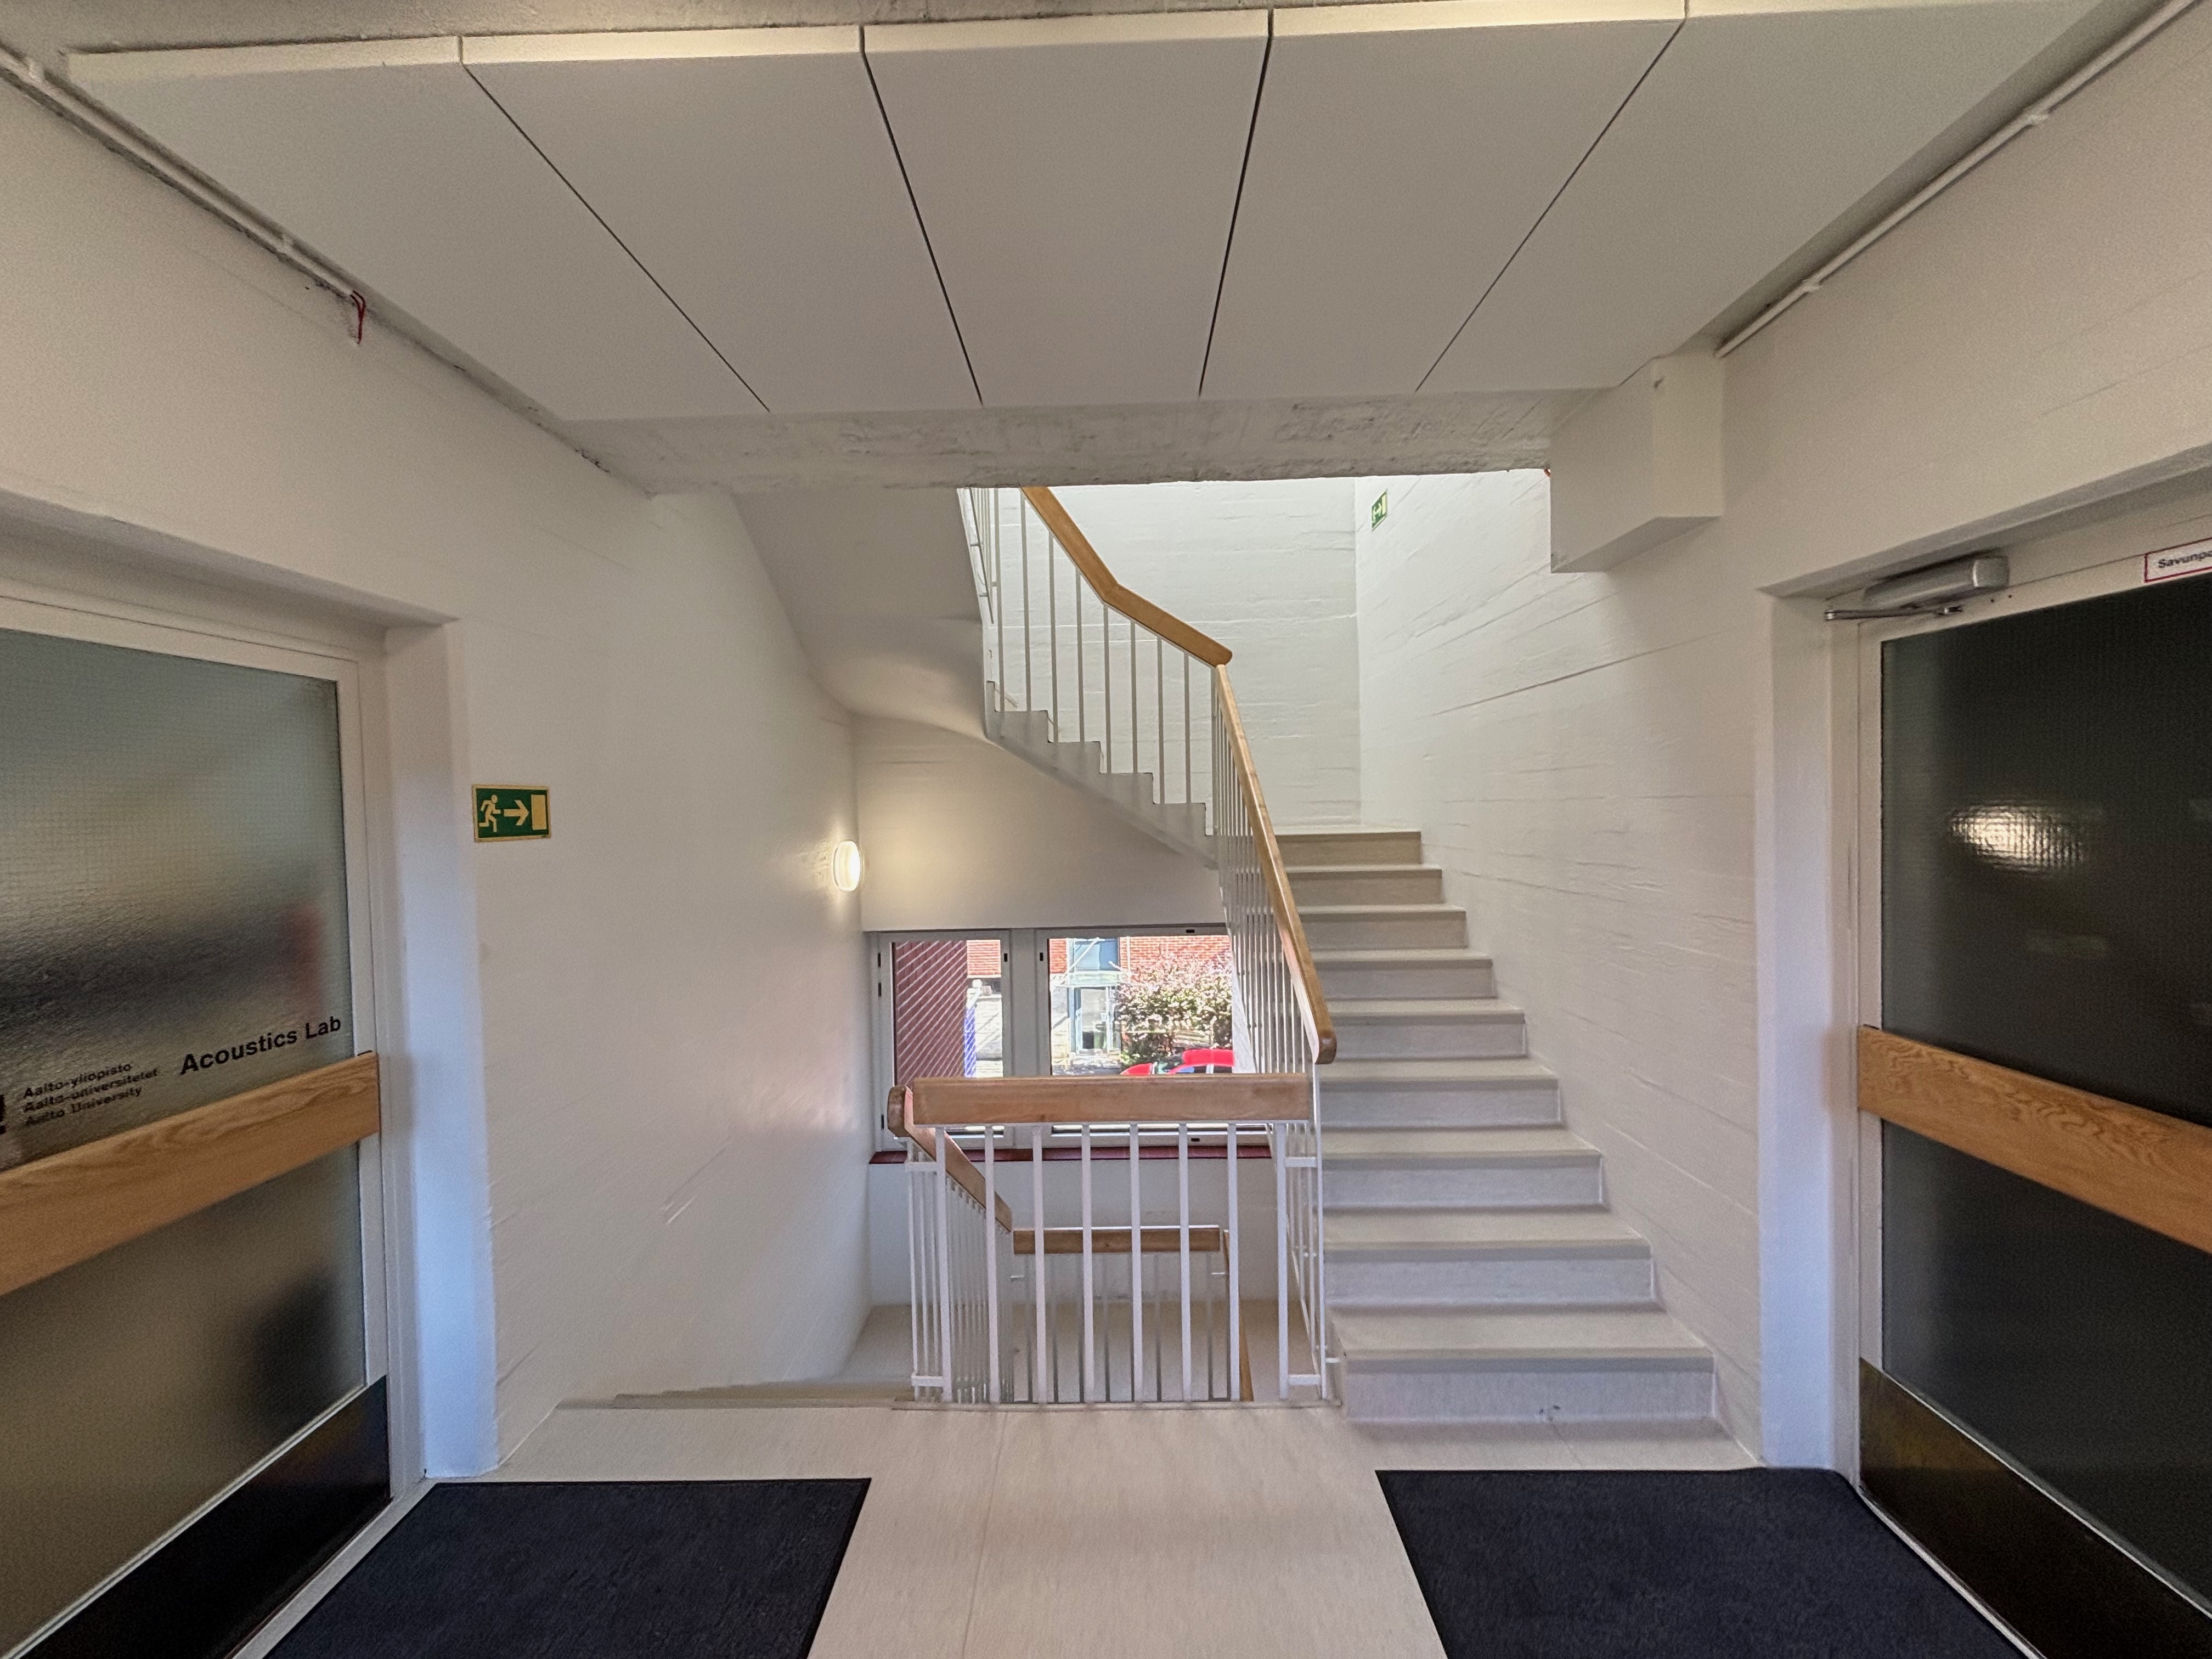
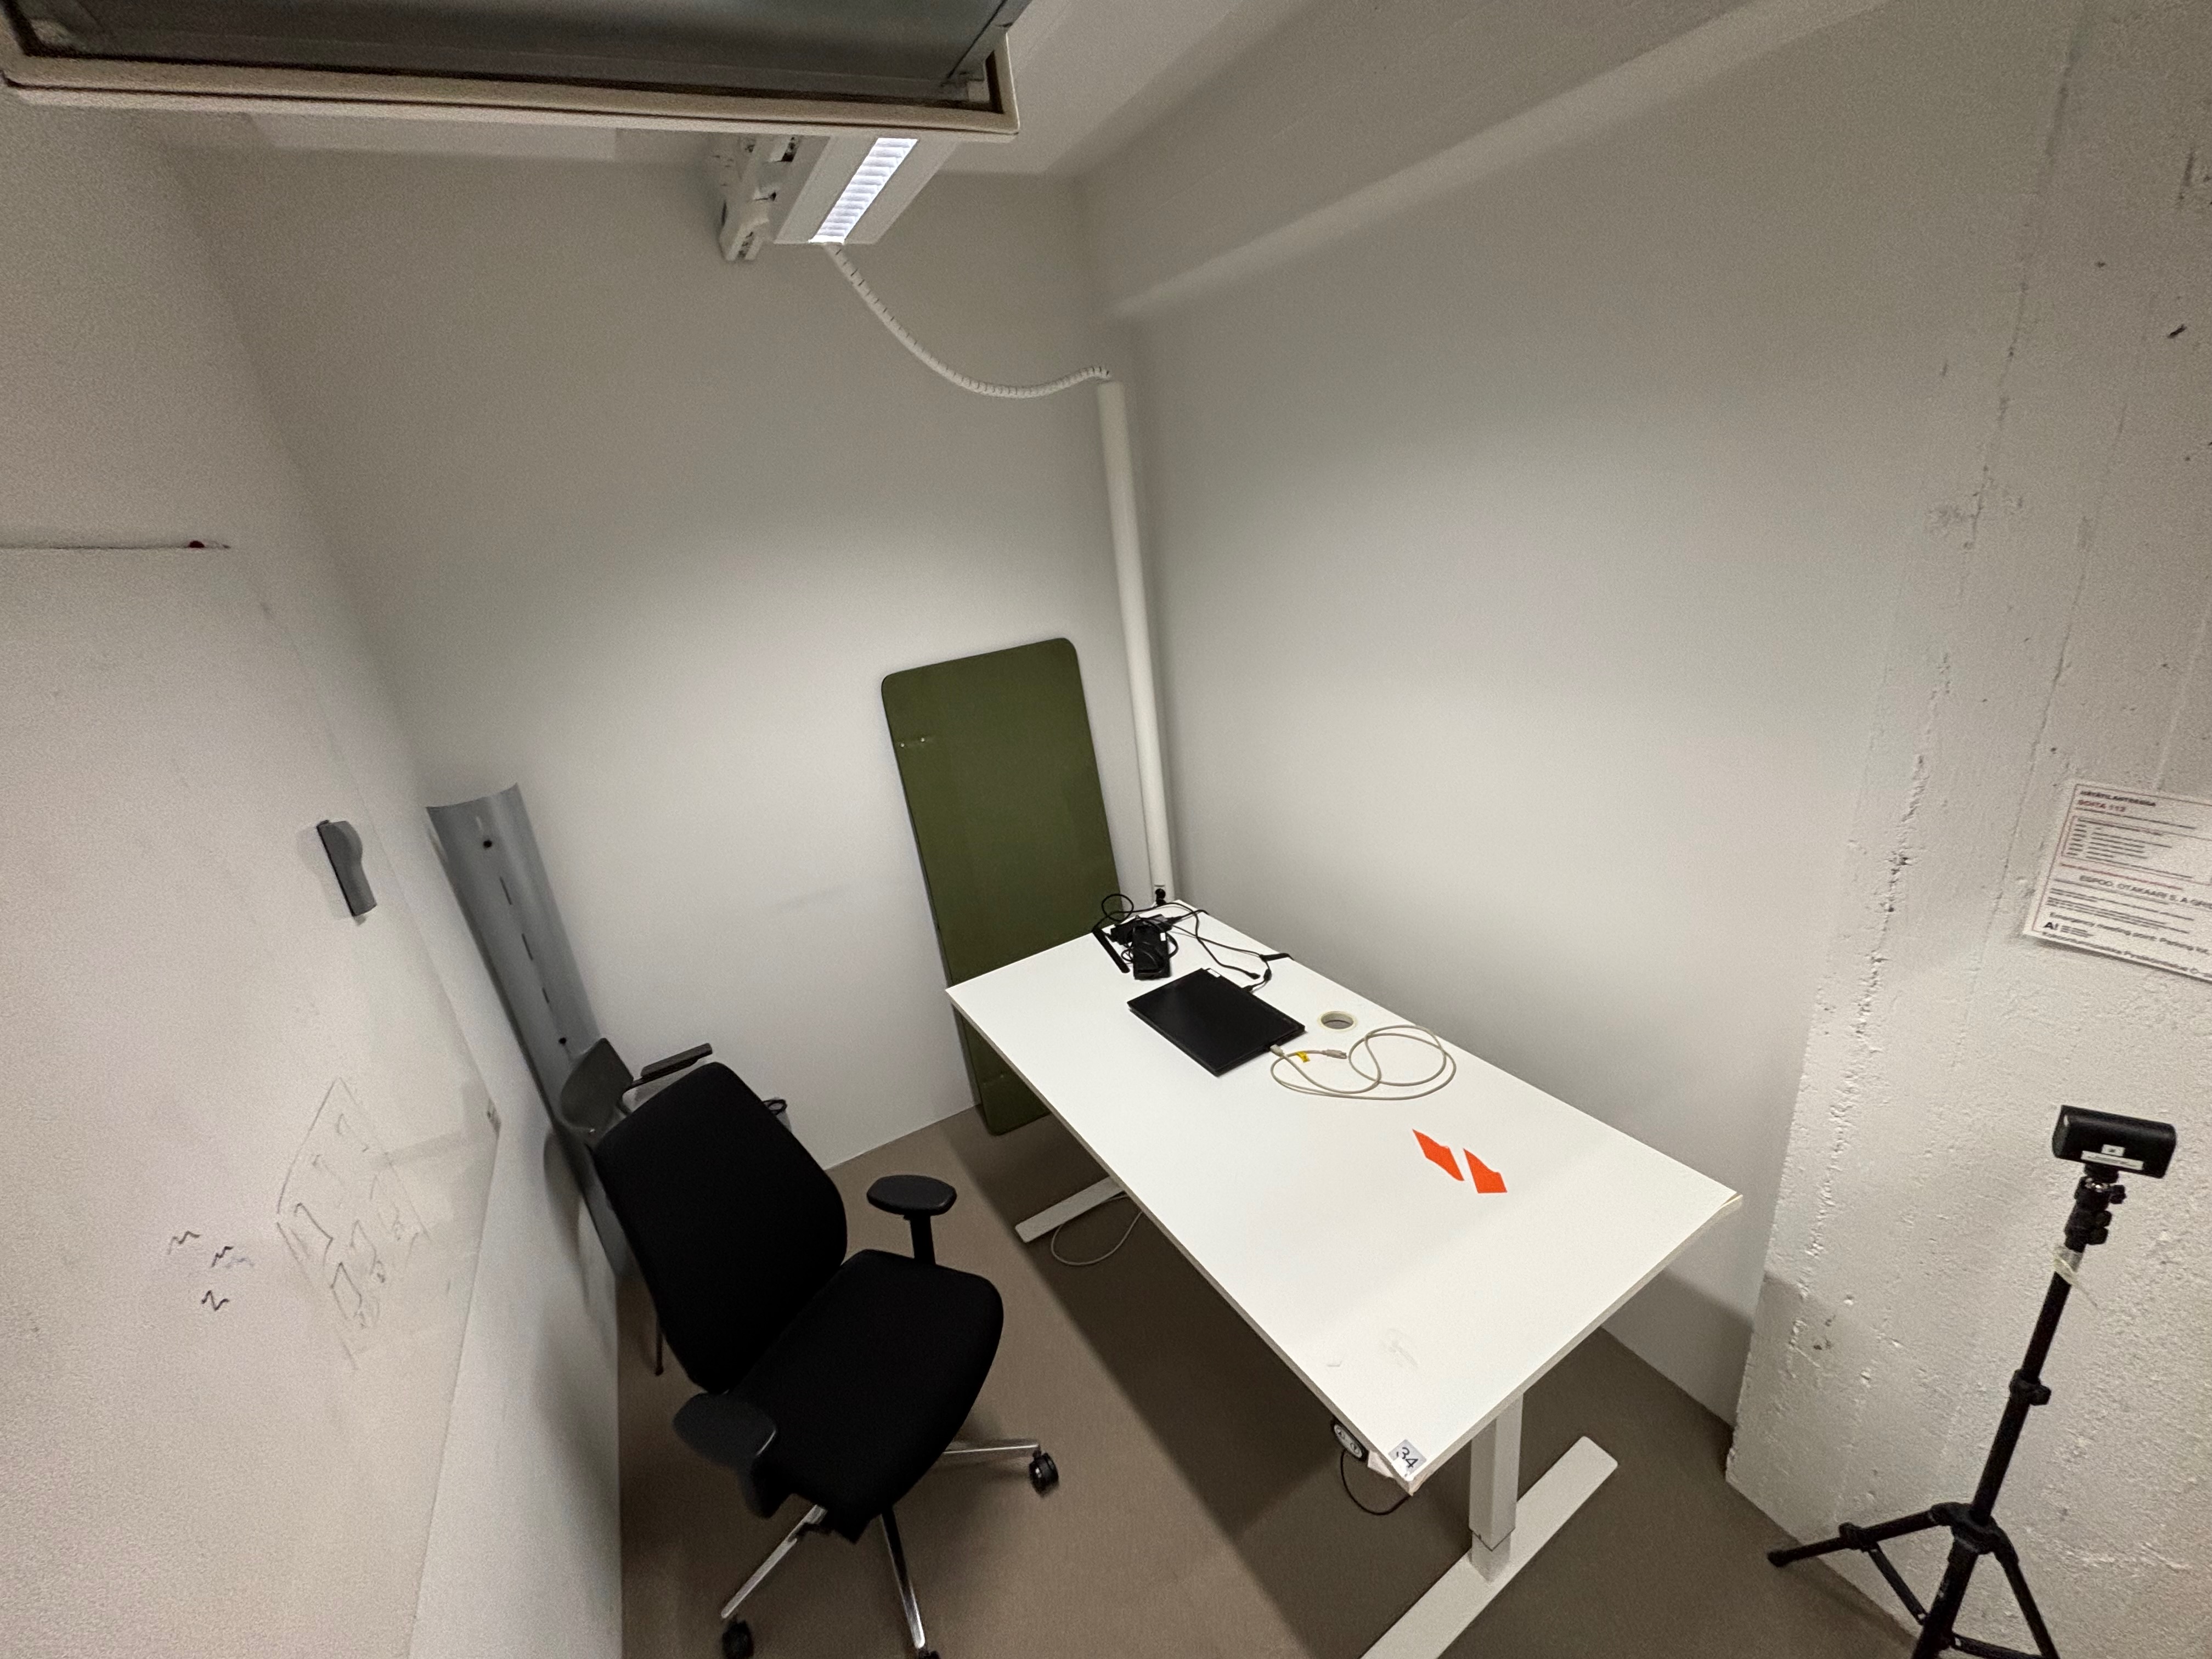
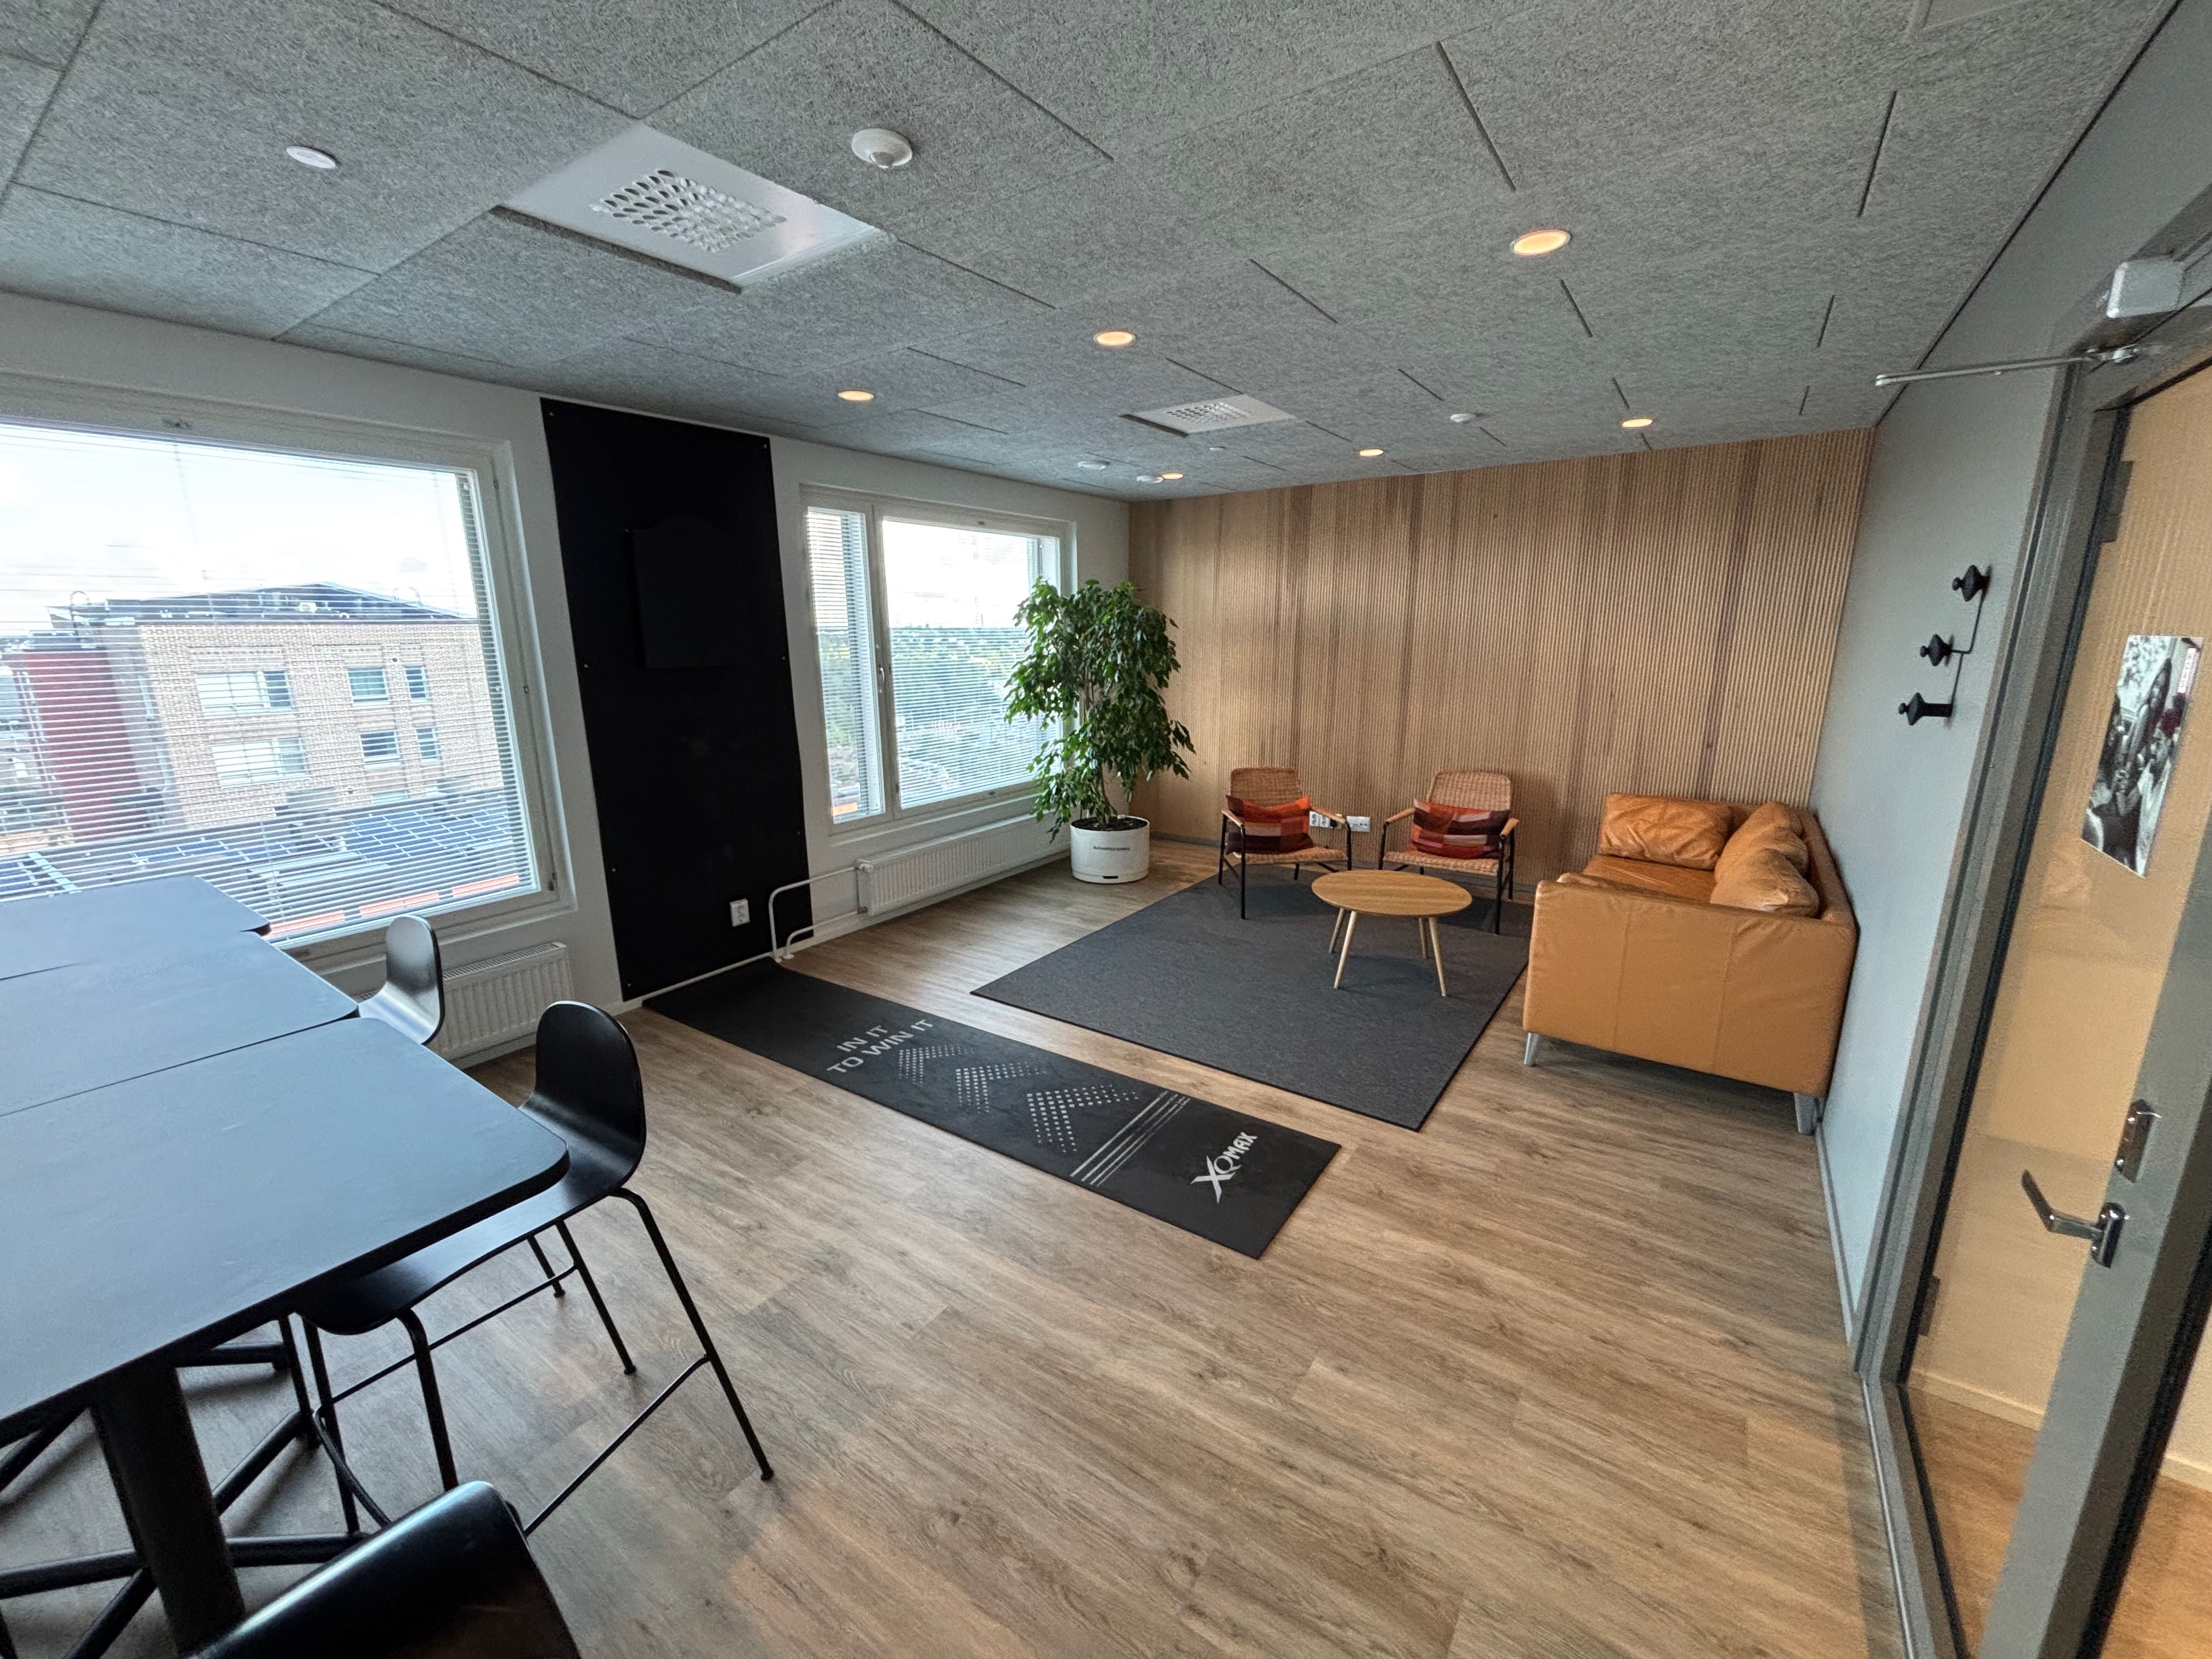
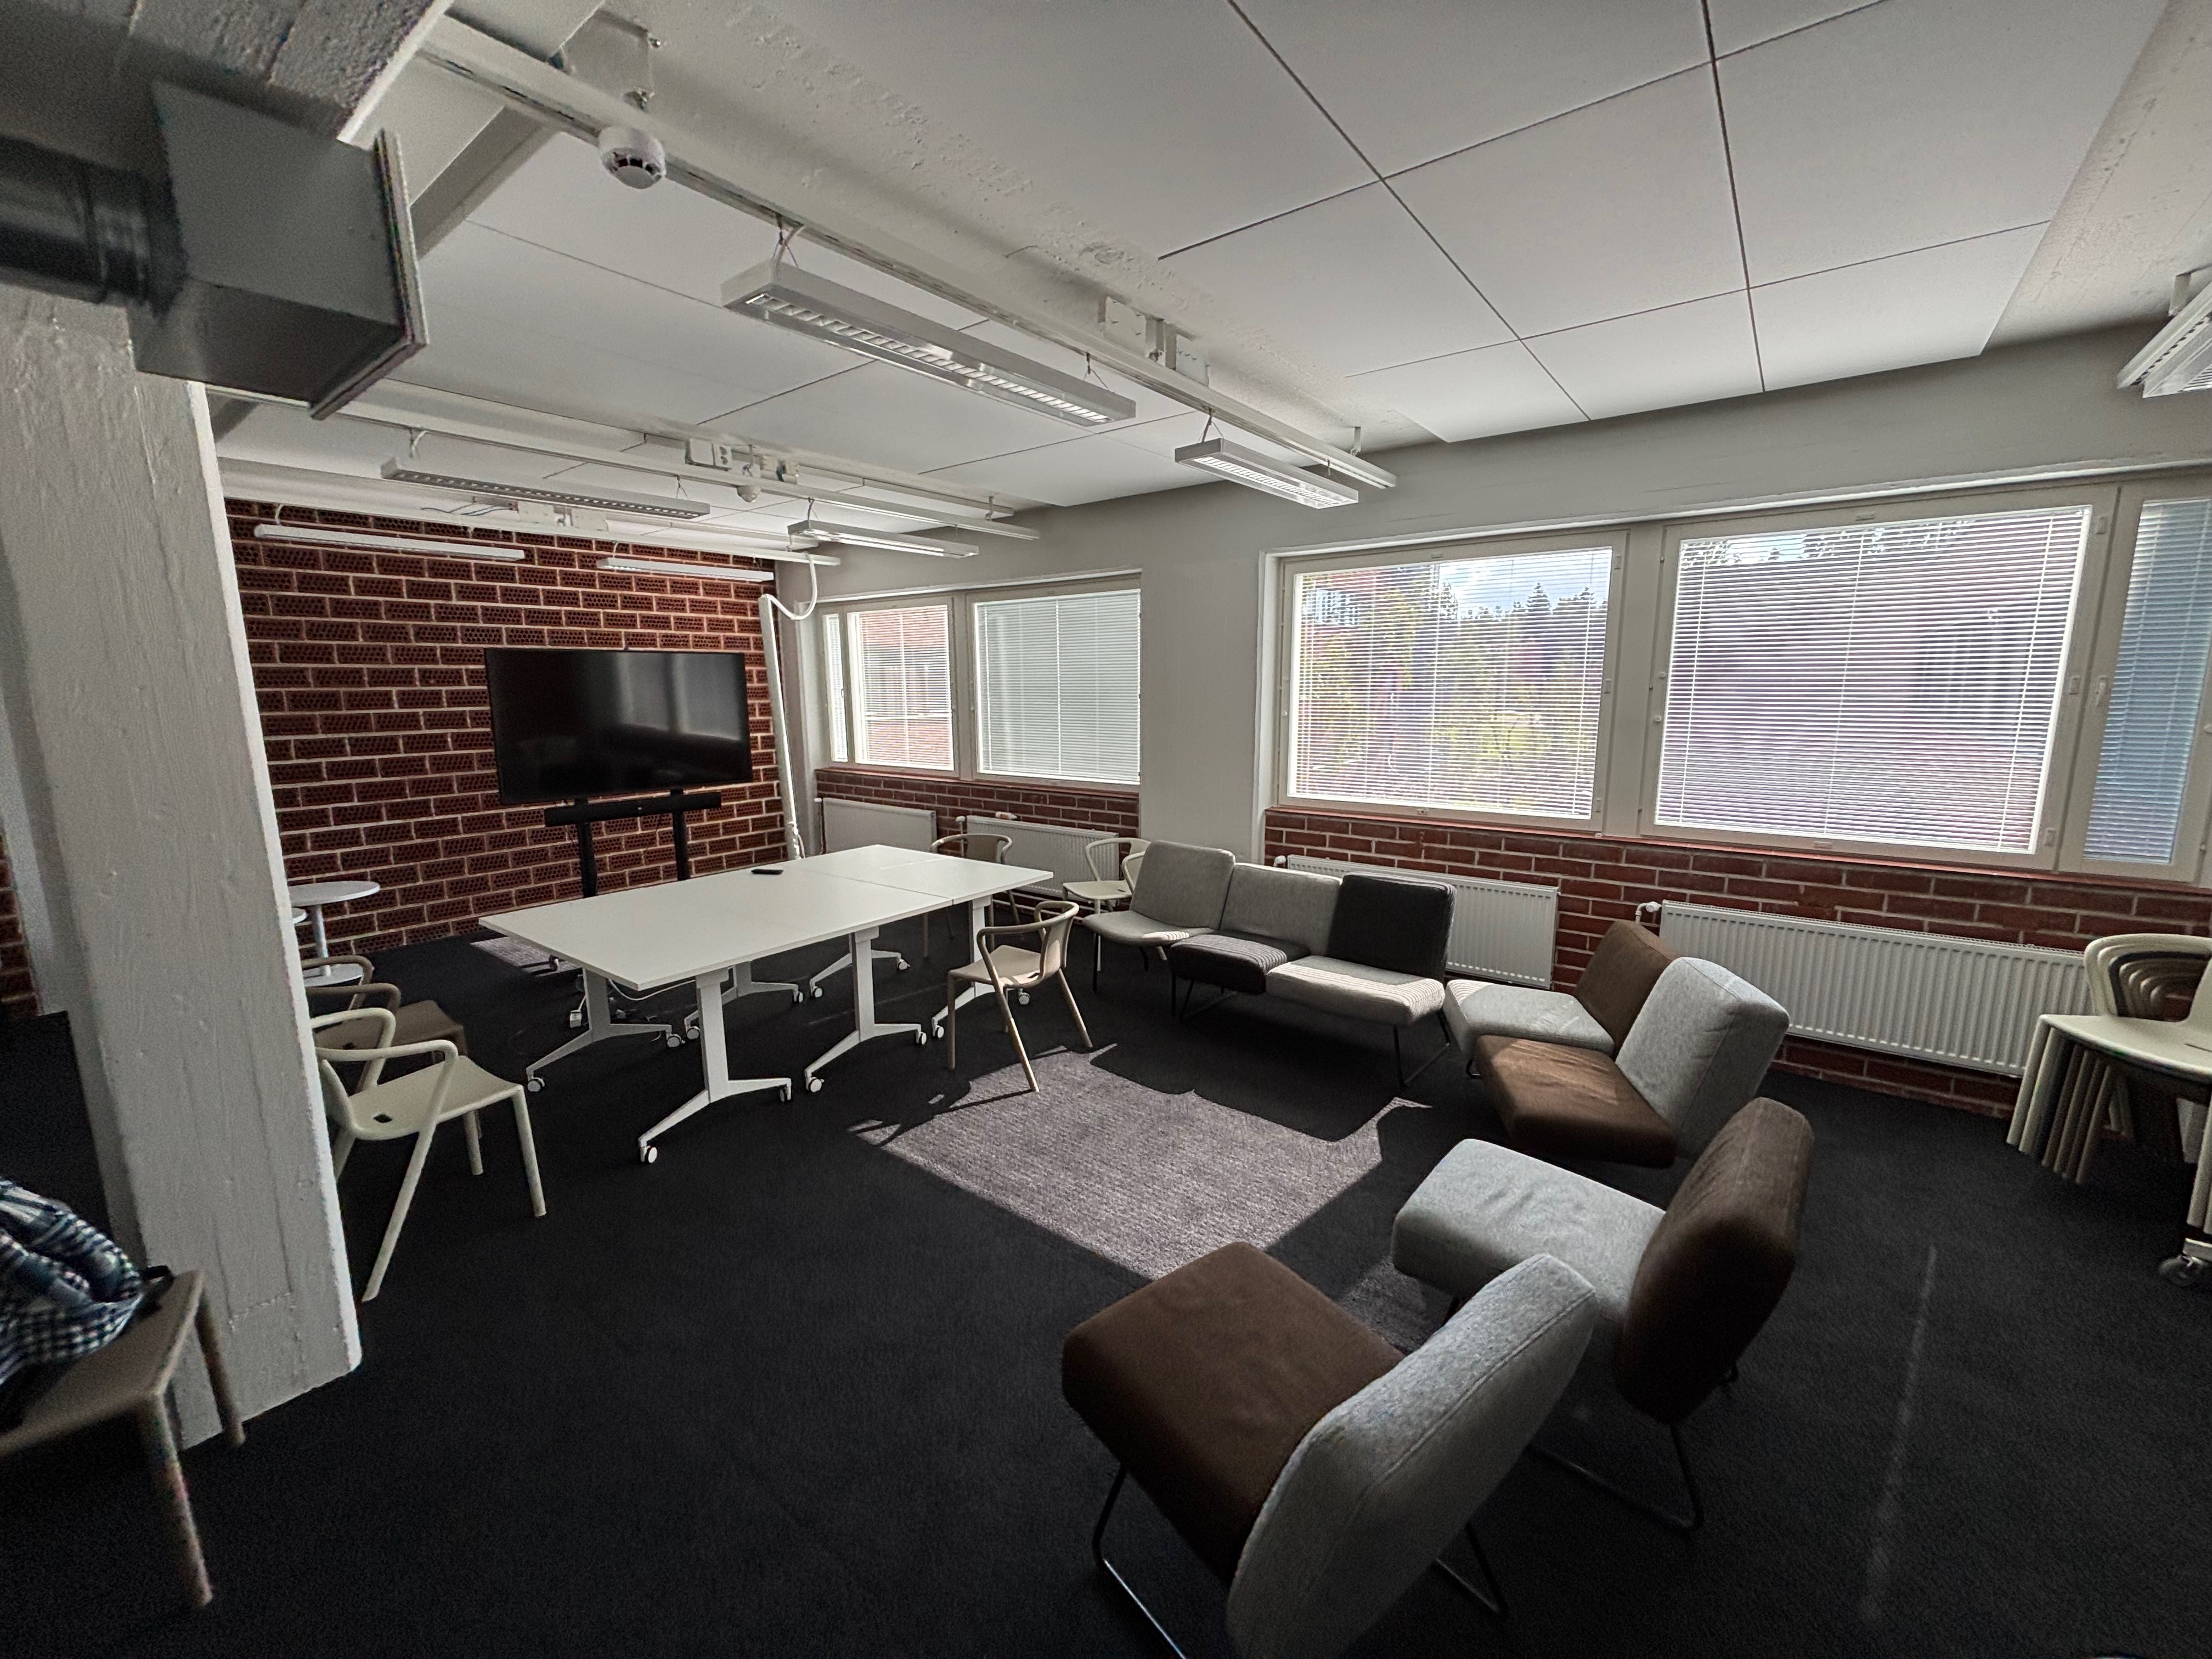
Recording rooms

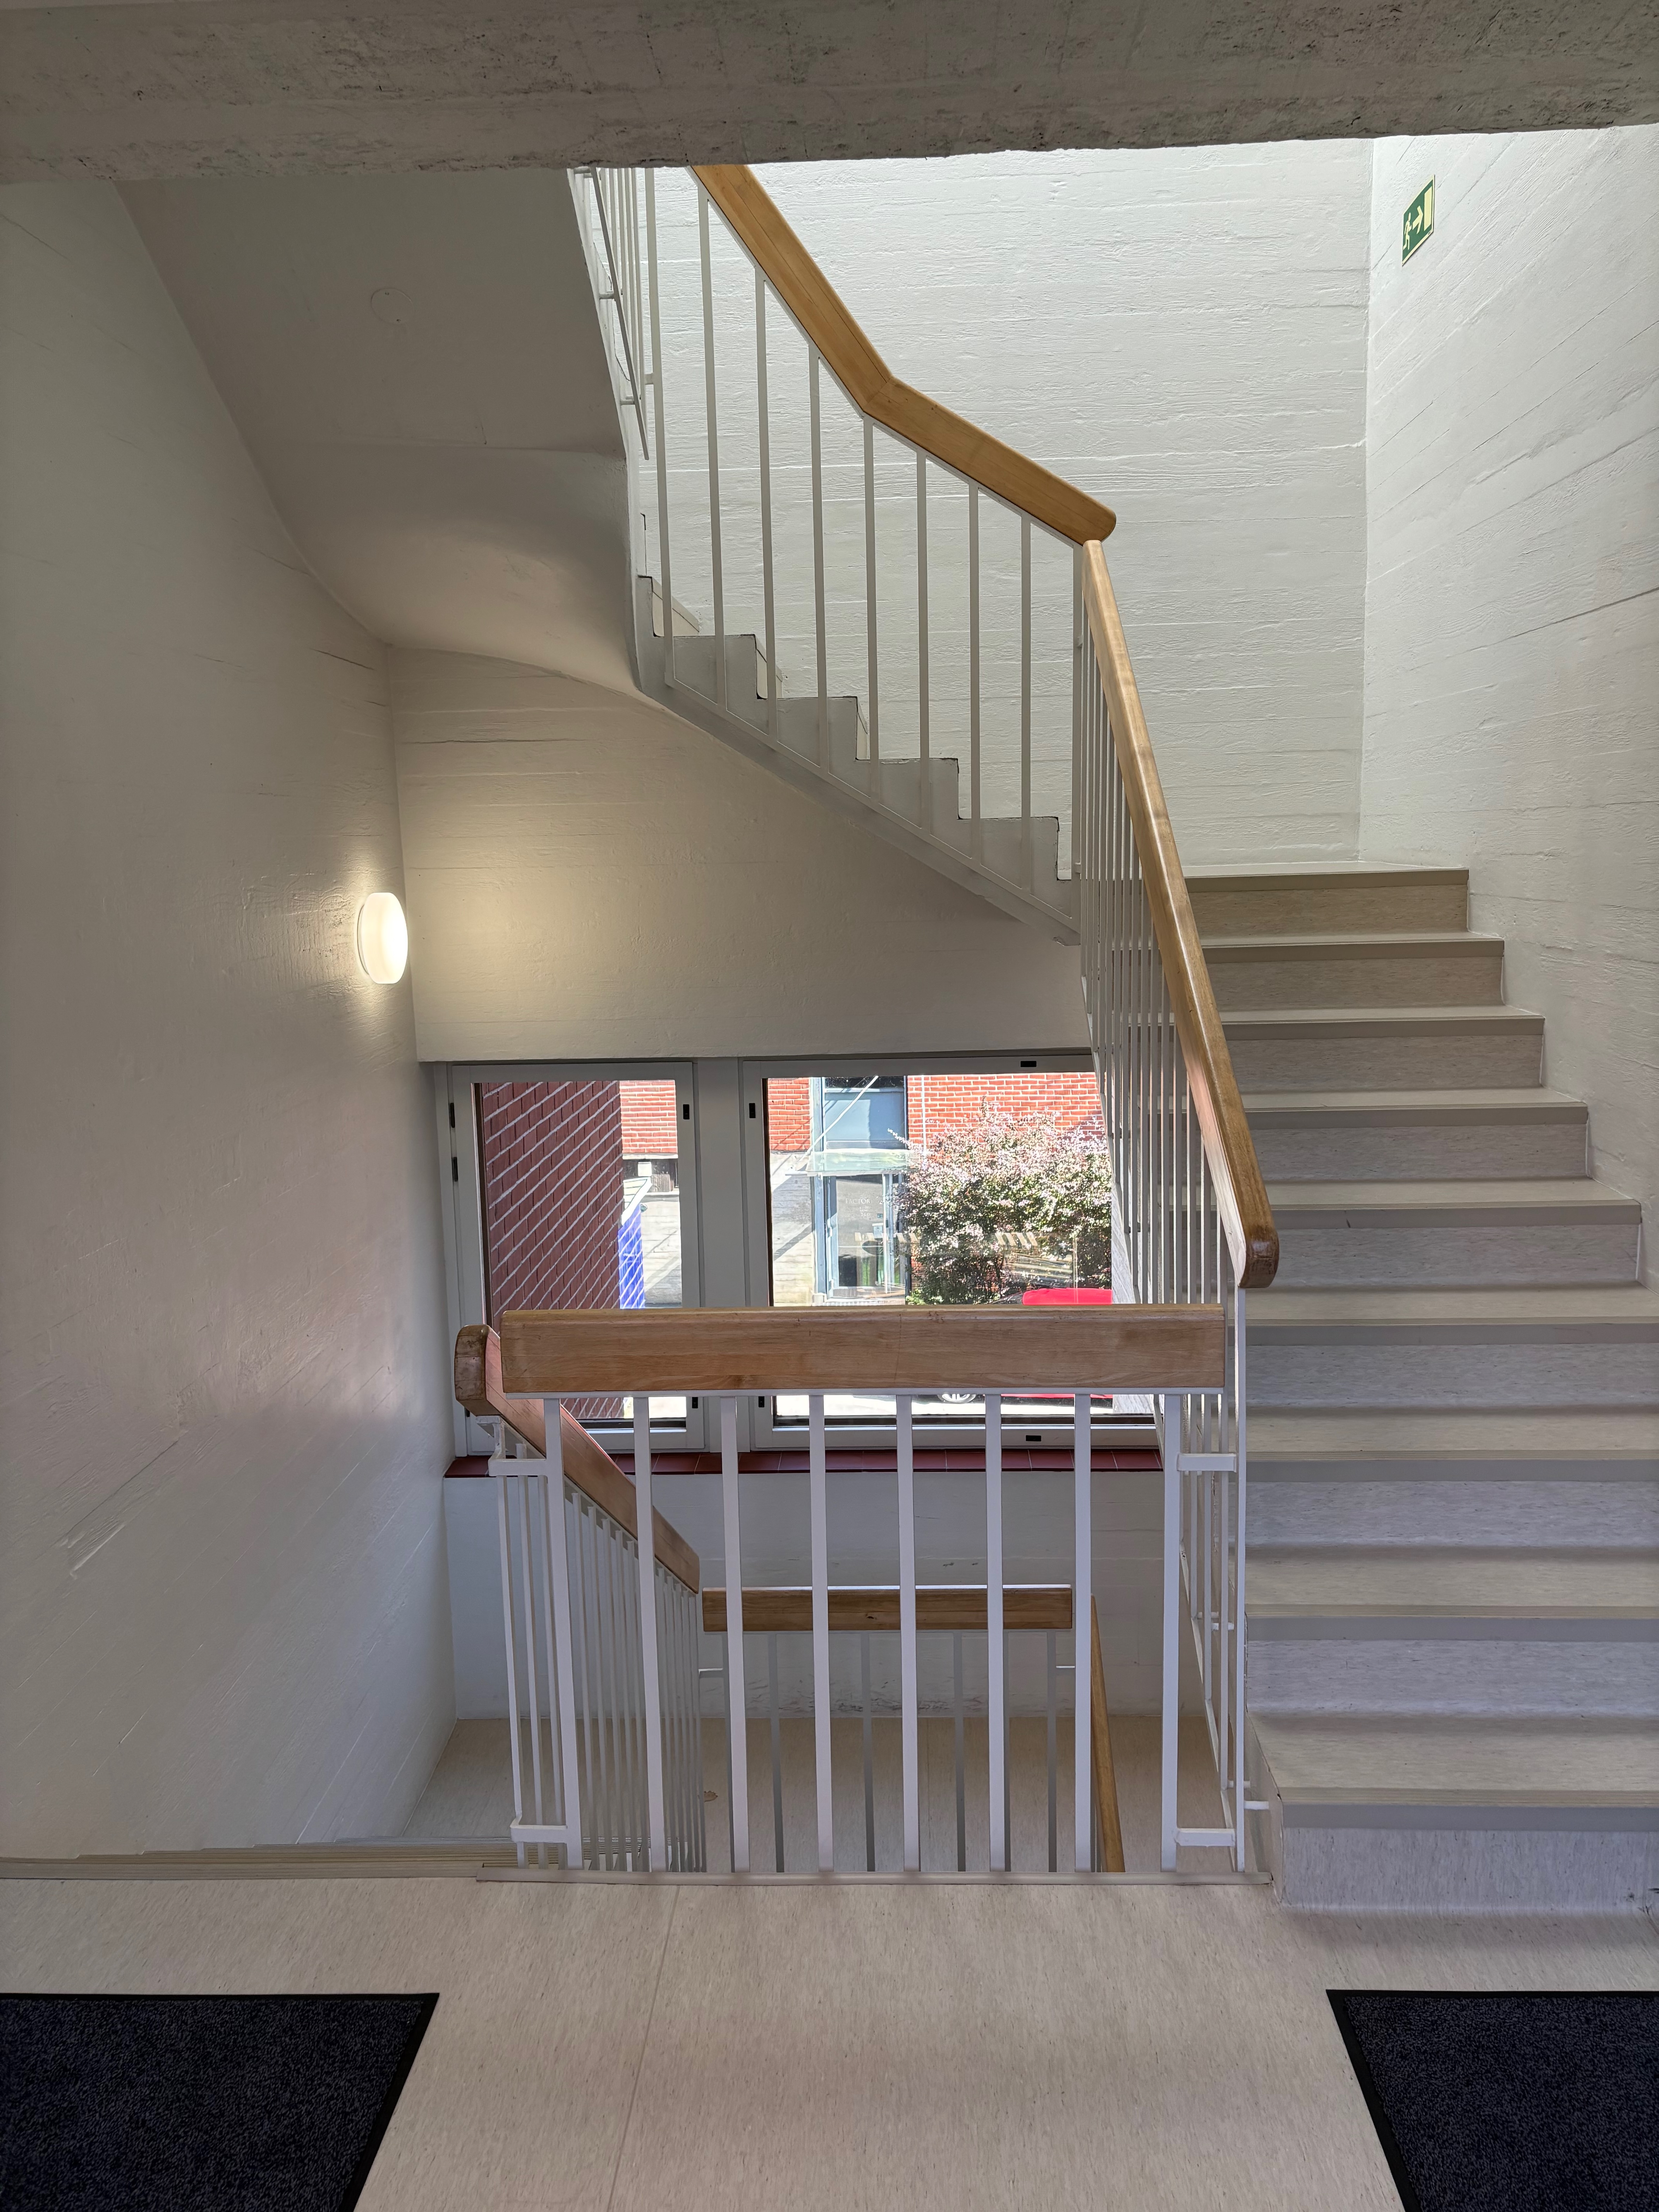
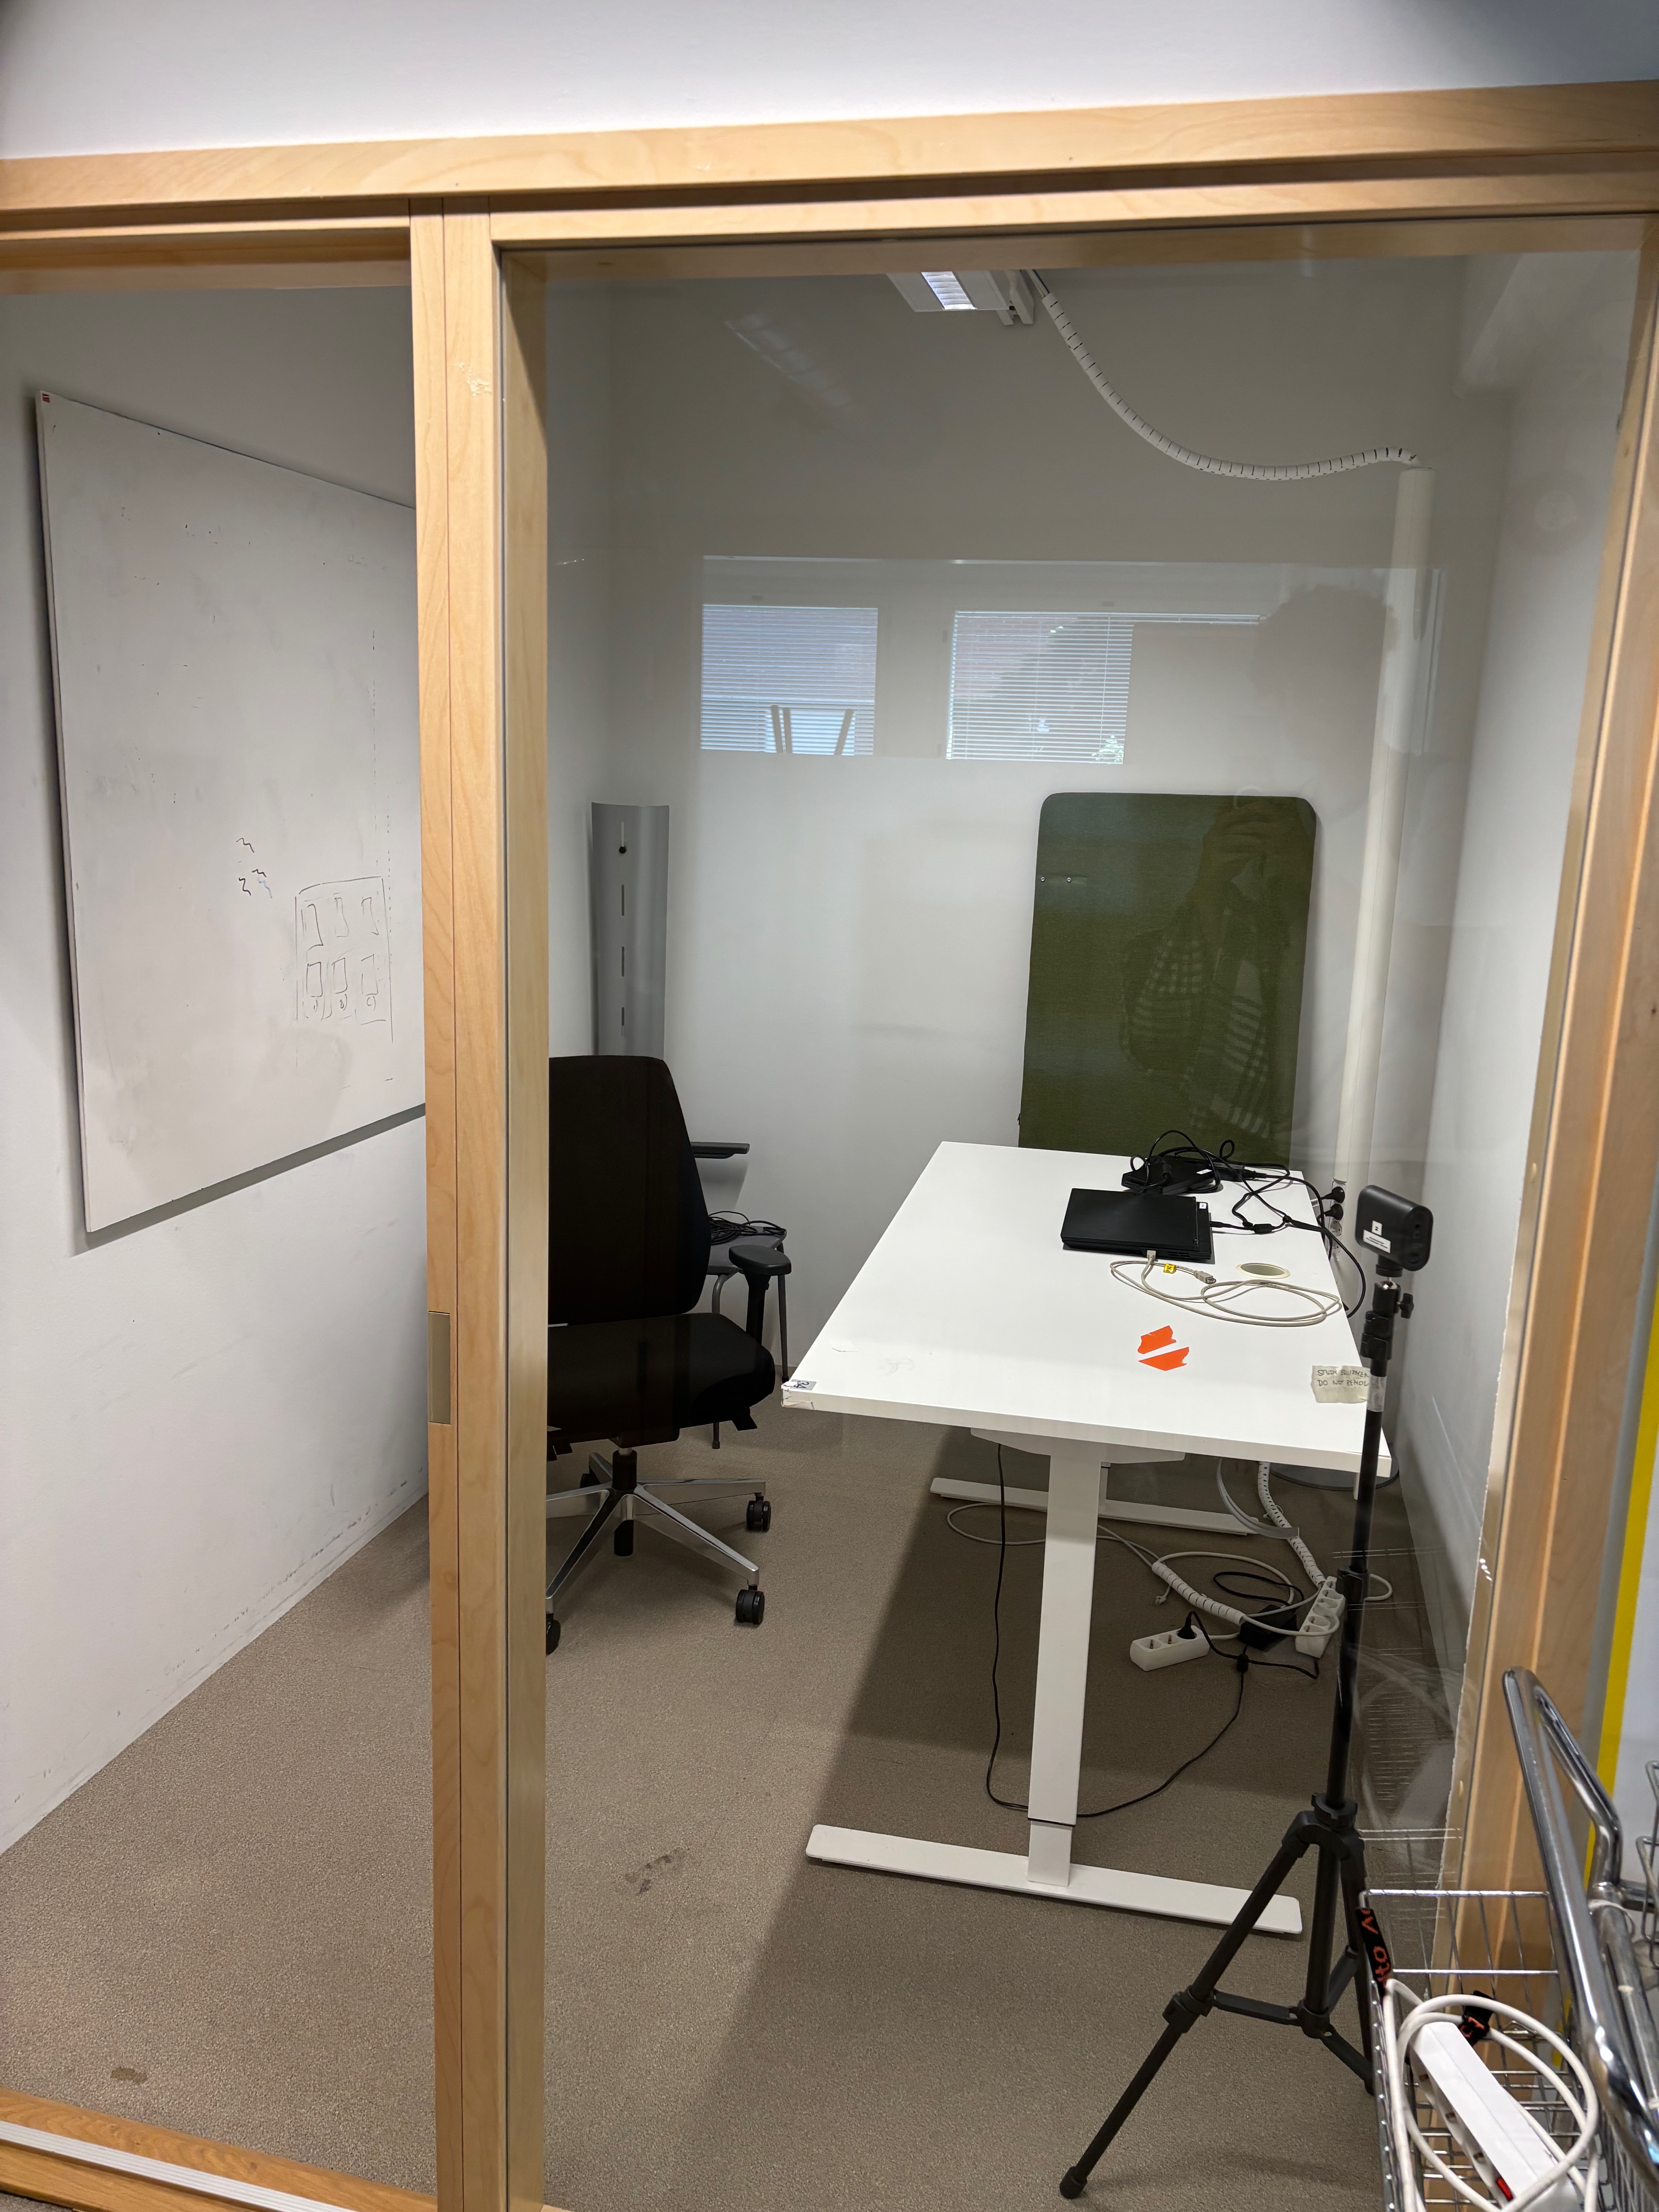
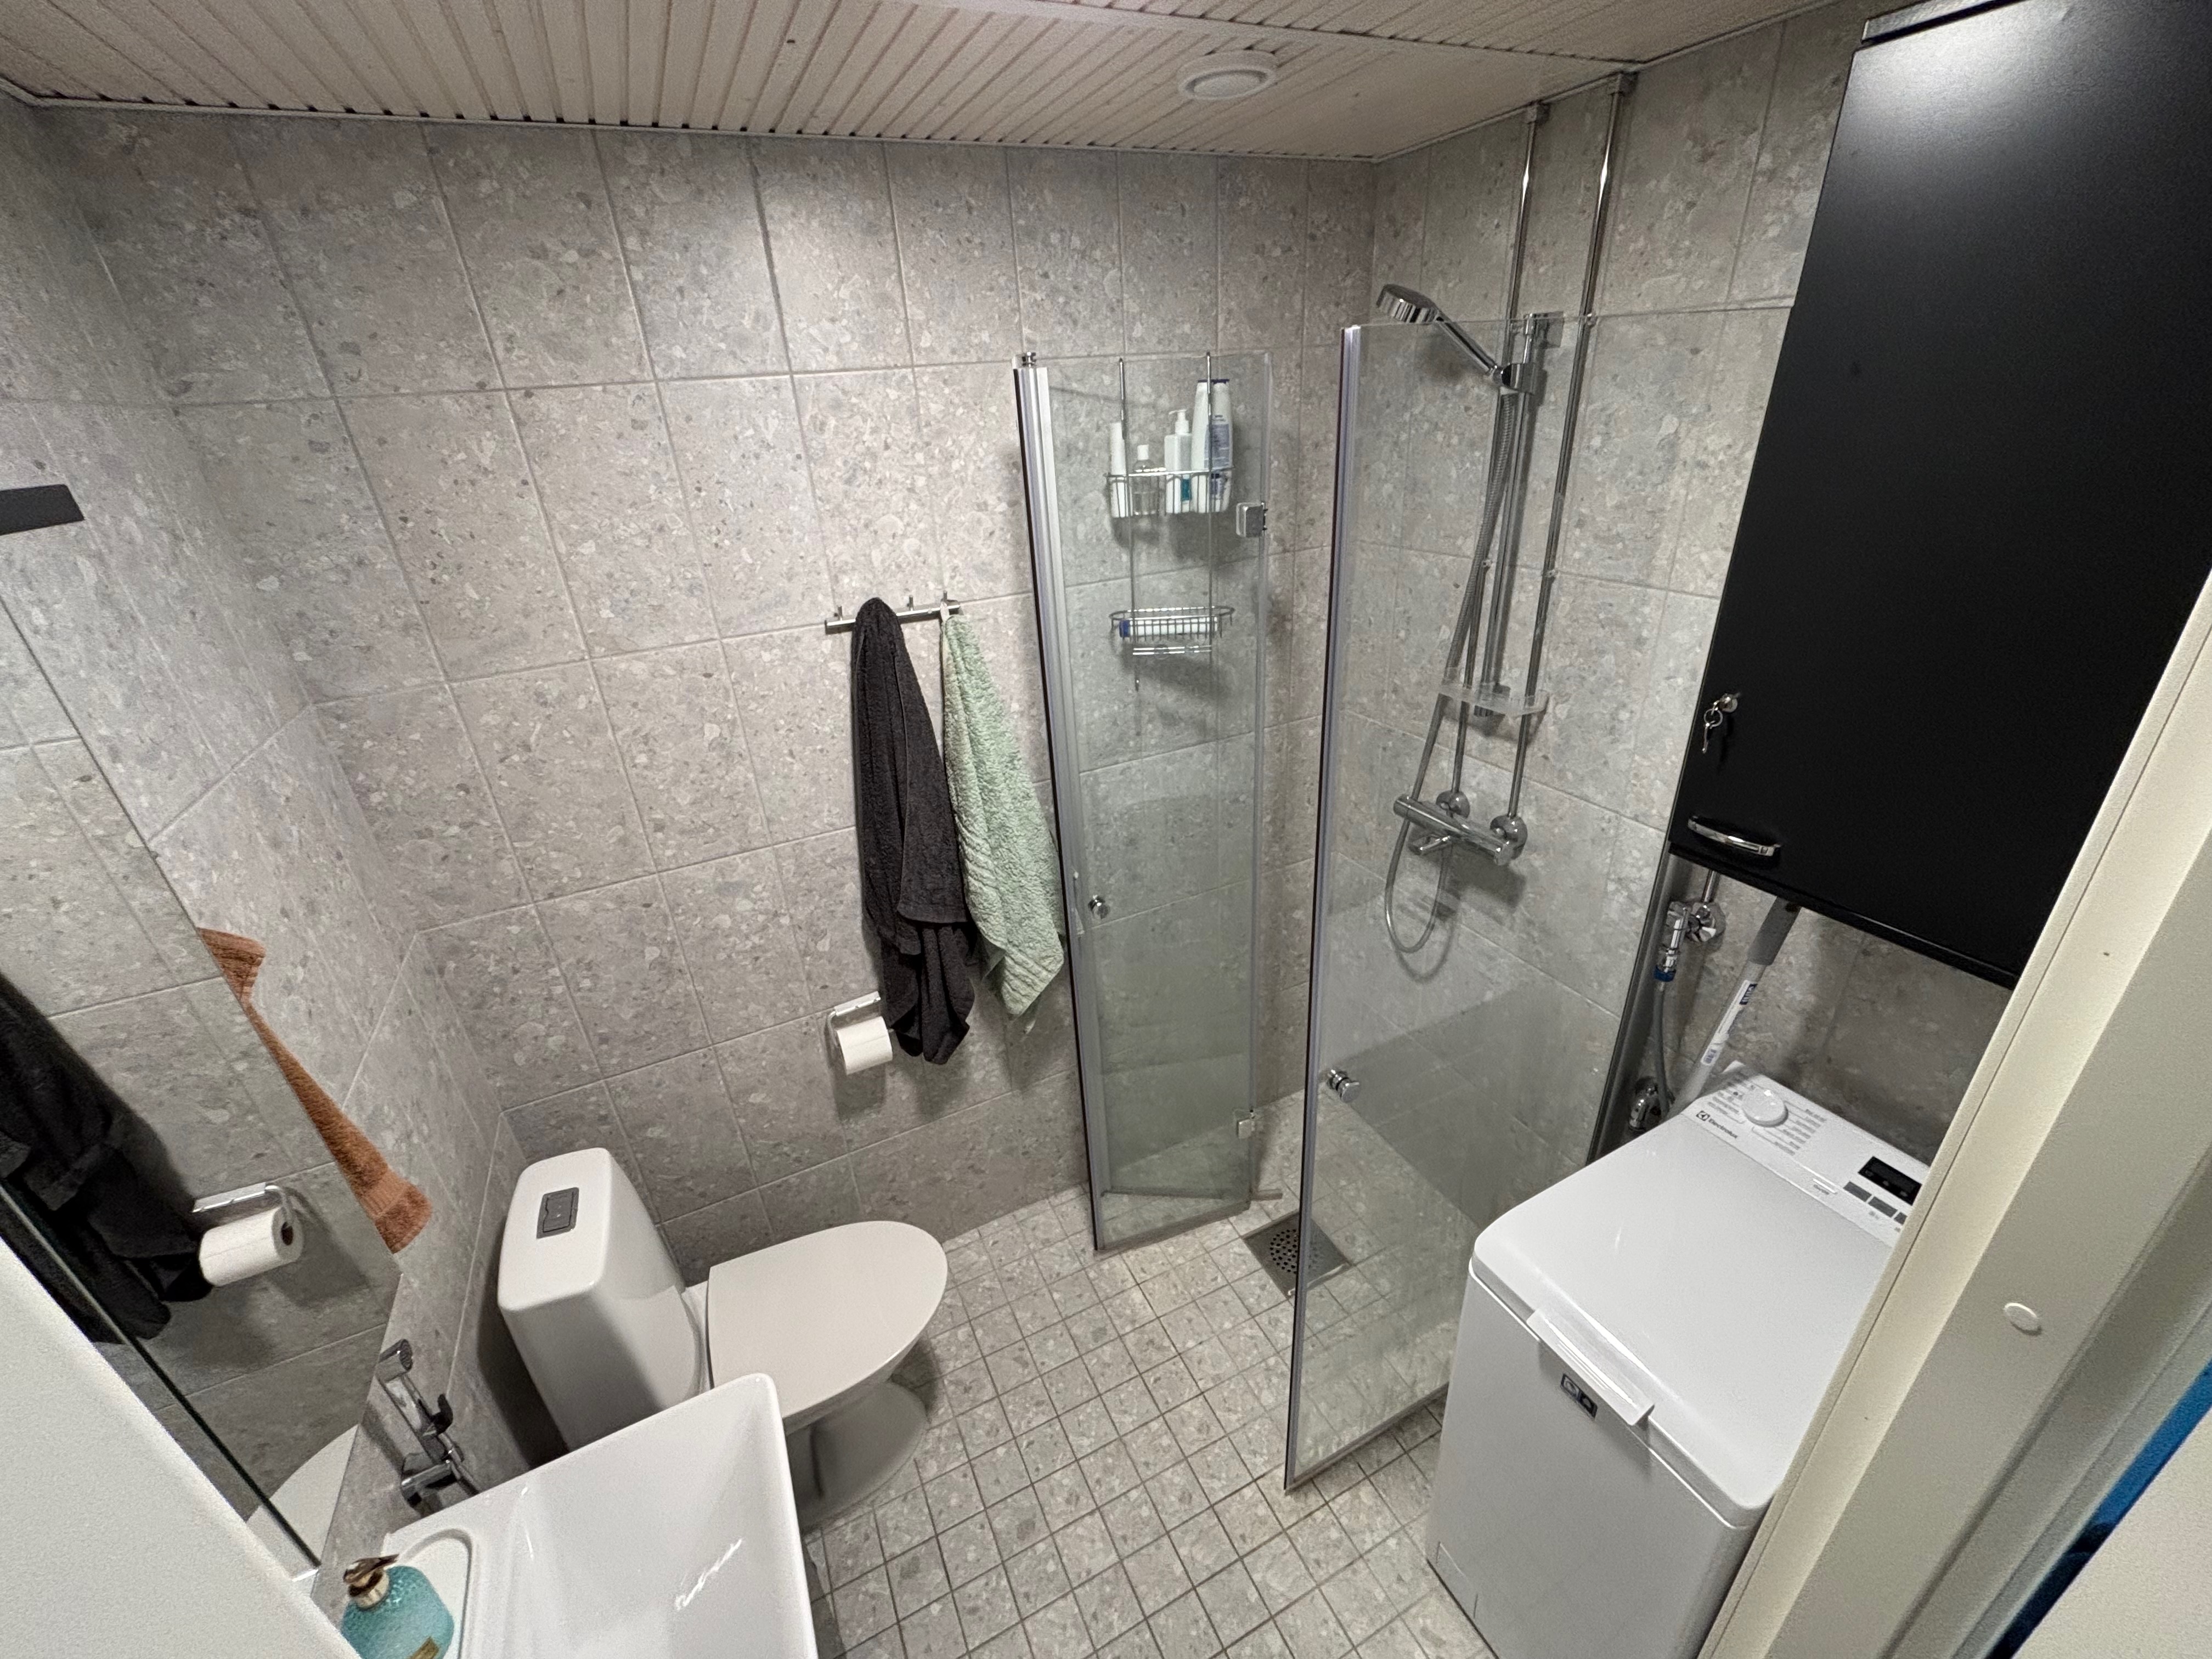
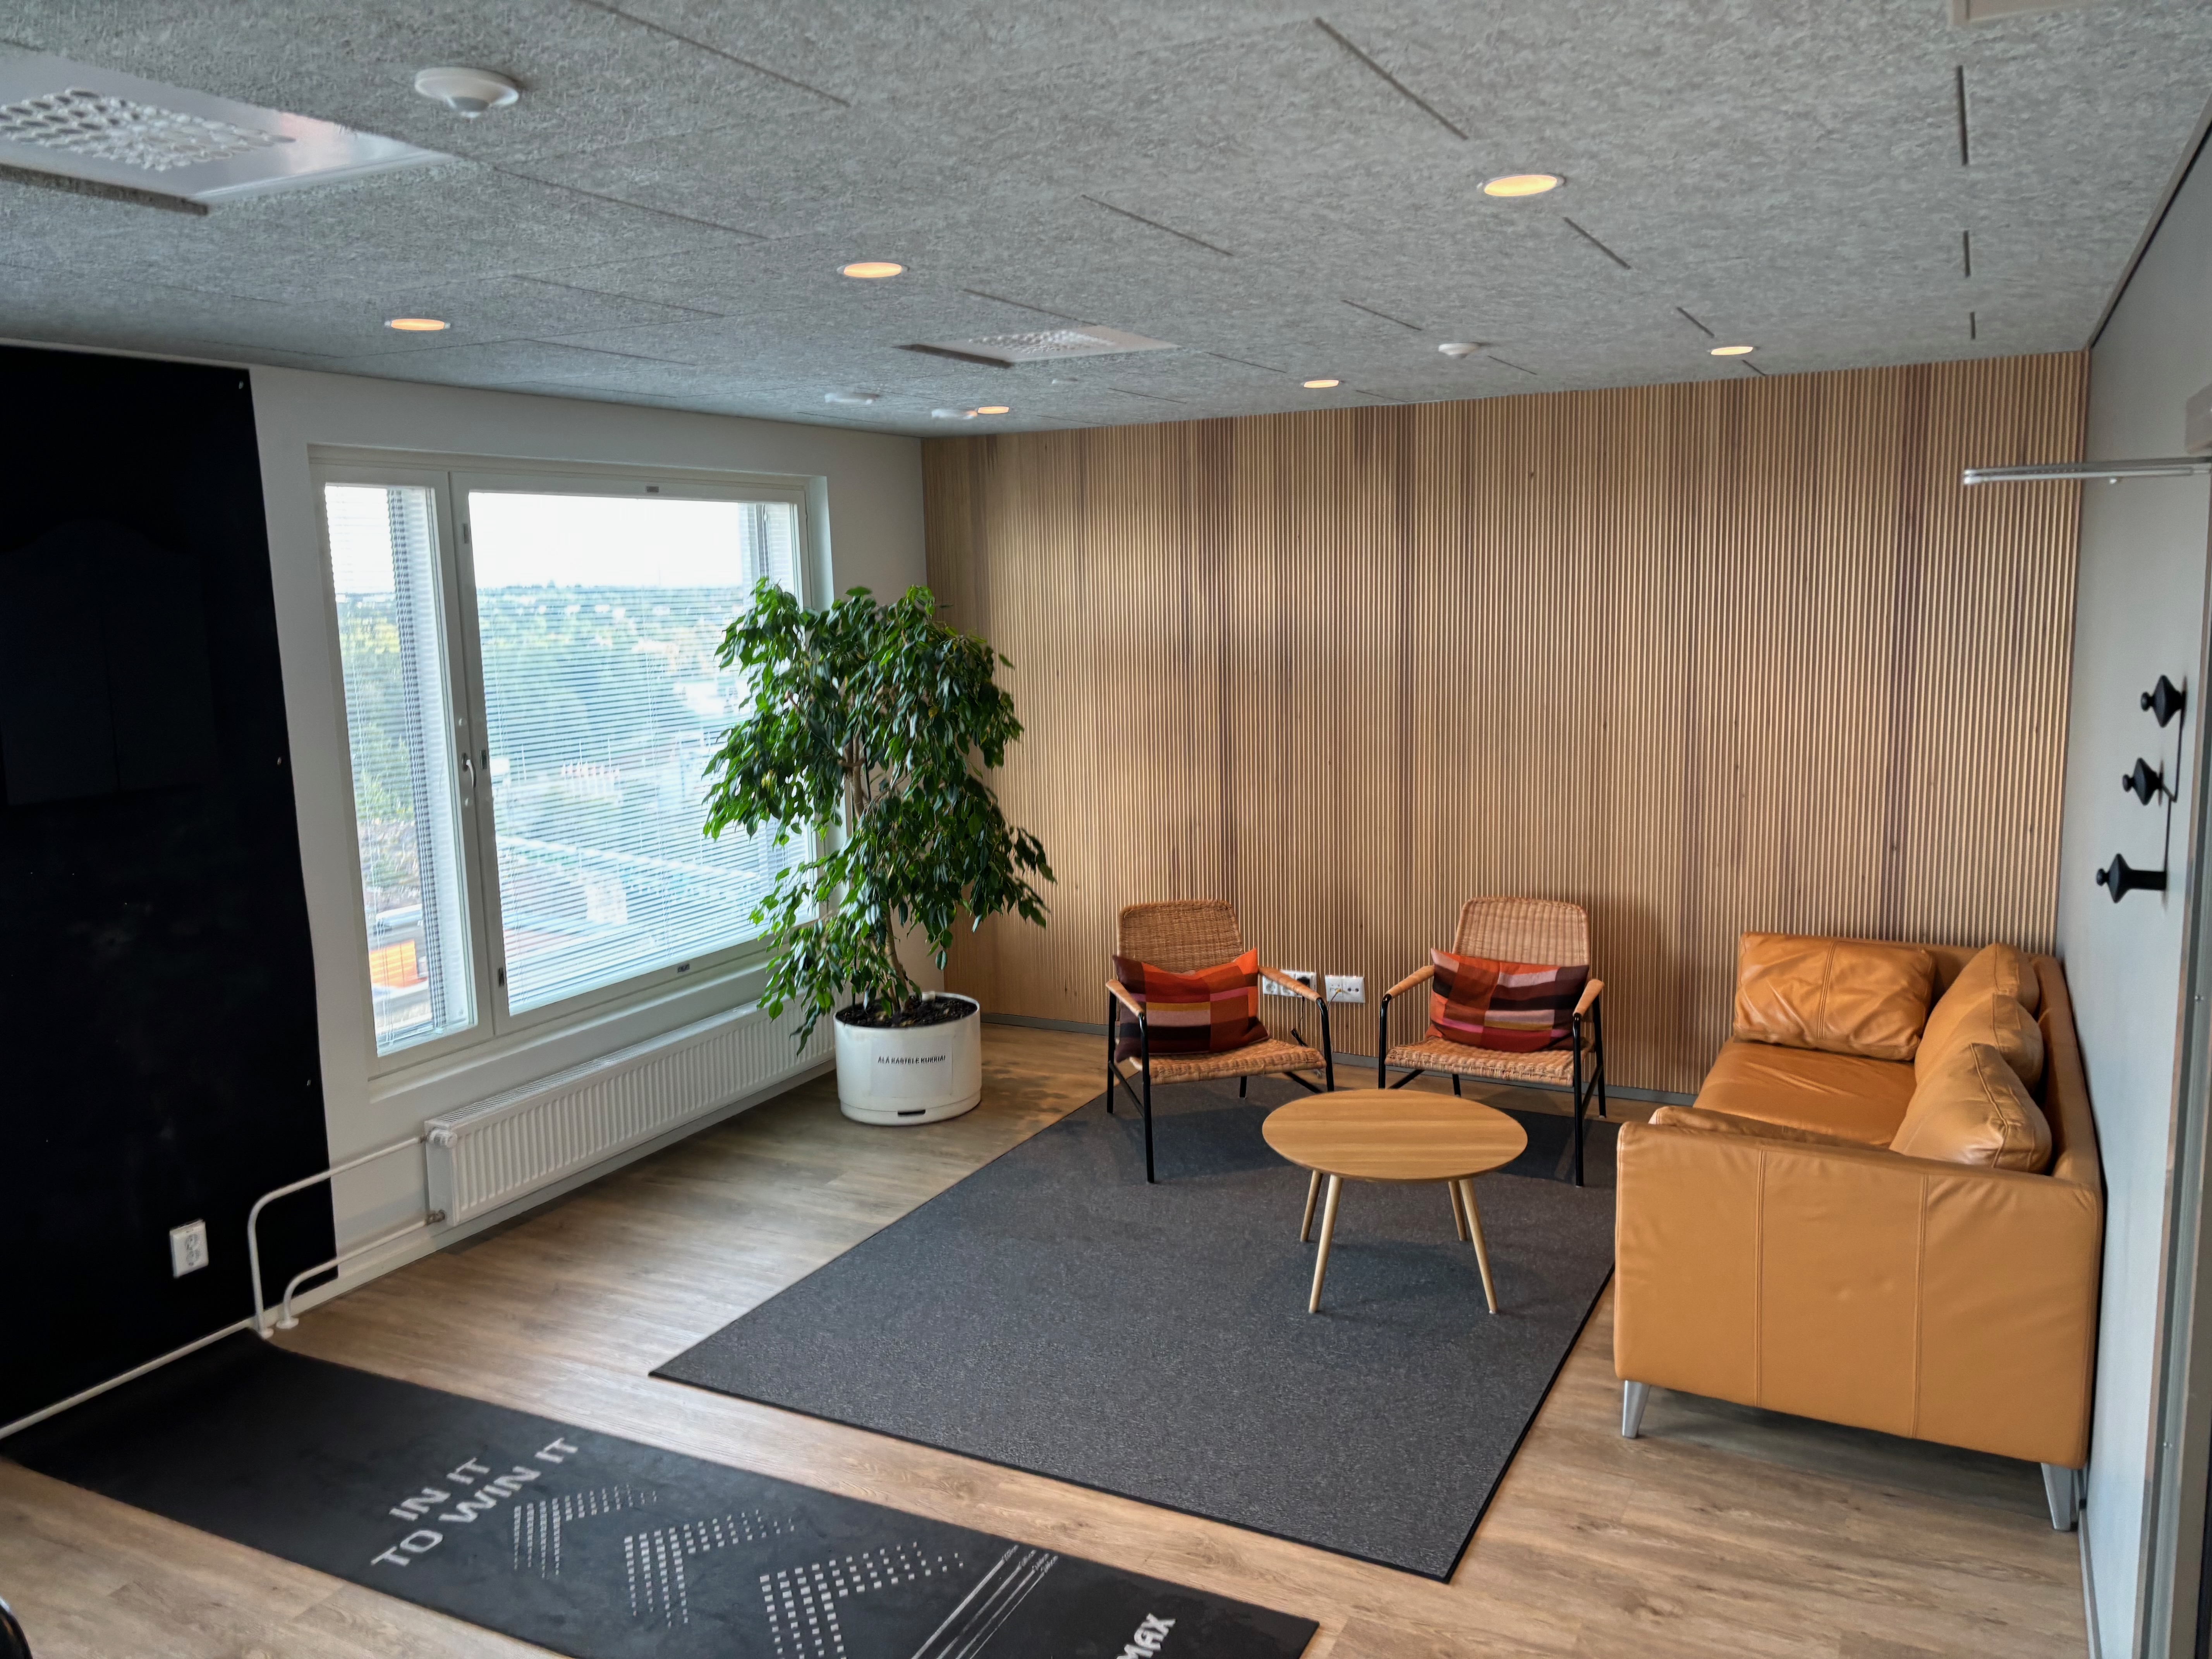
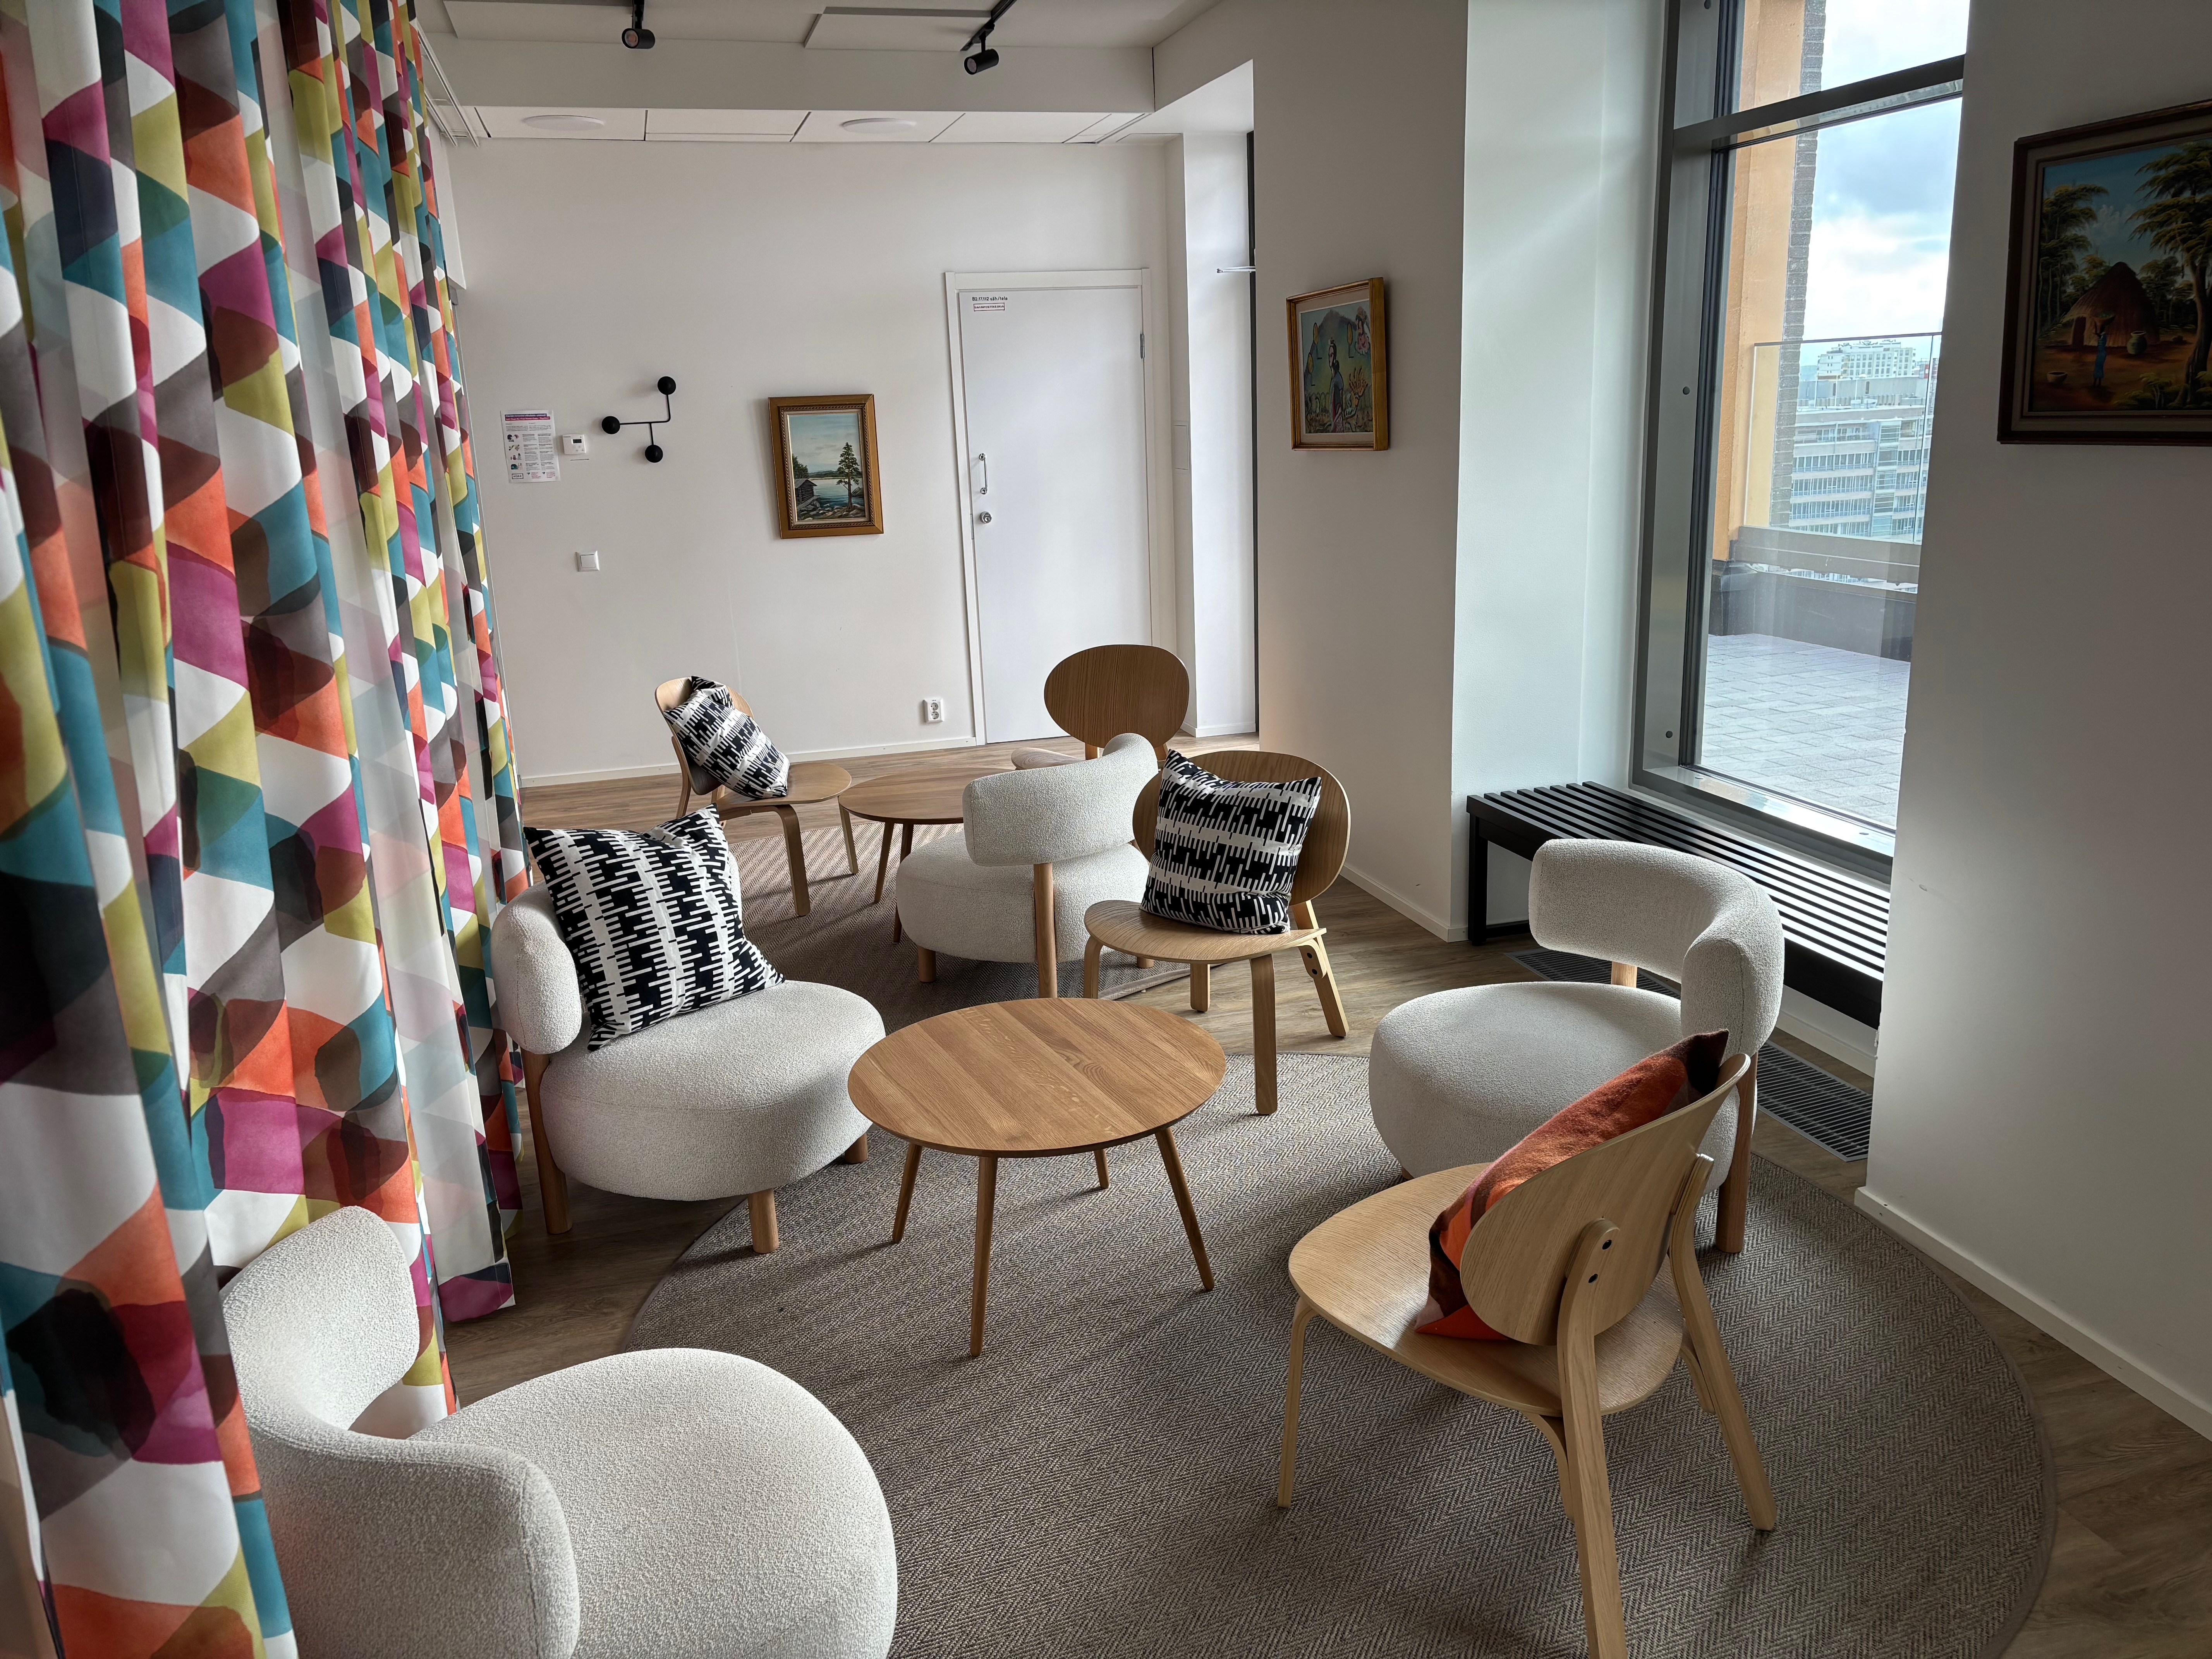
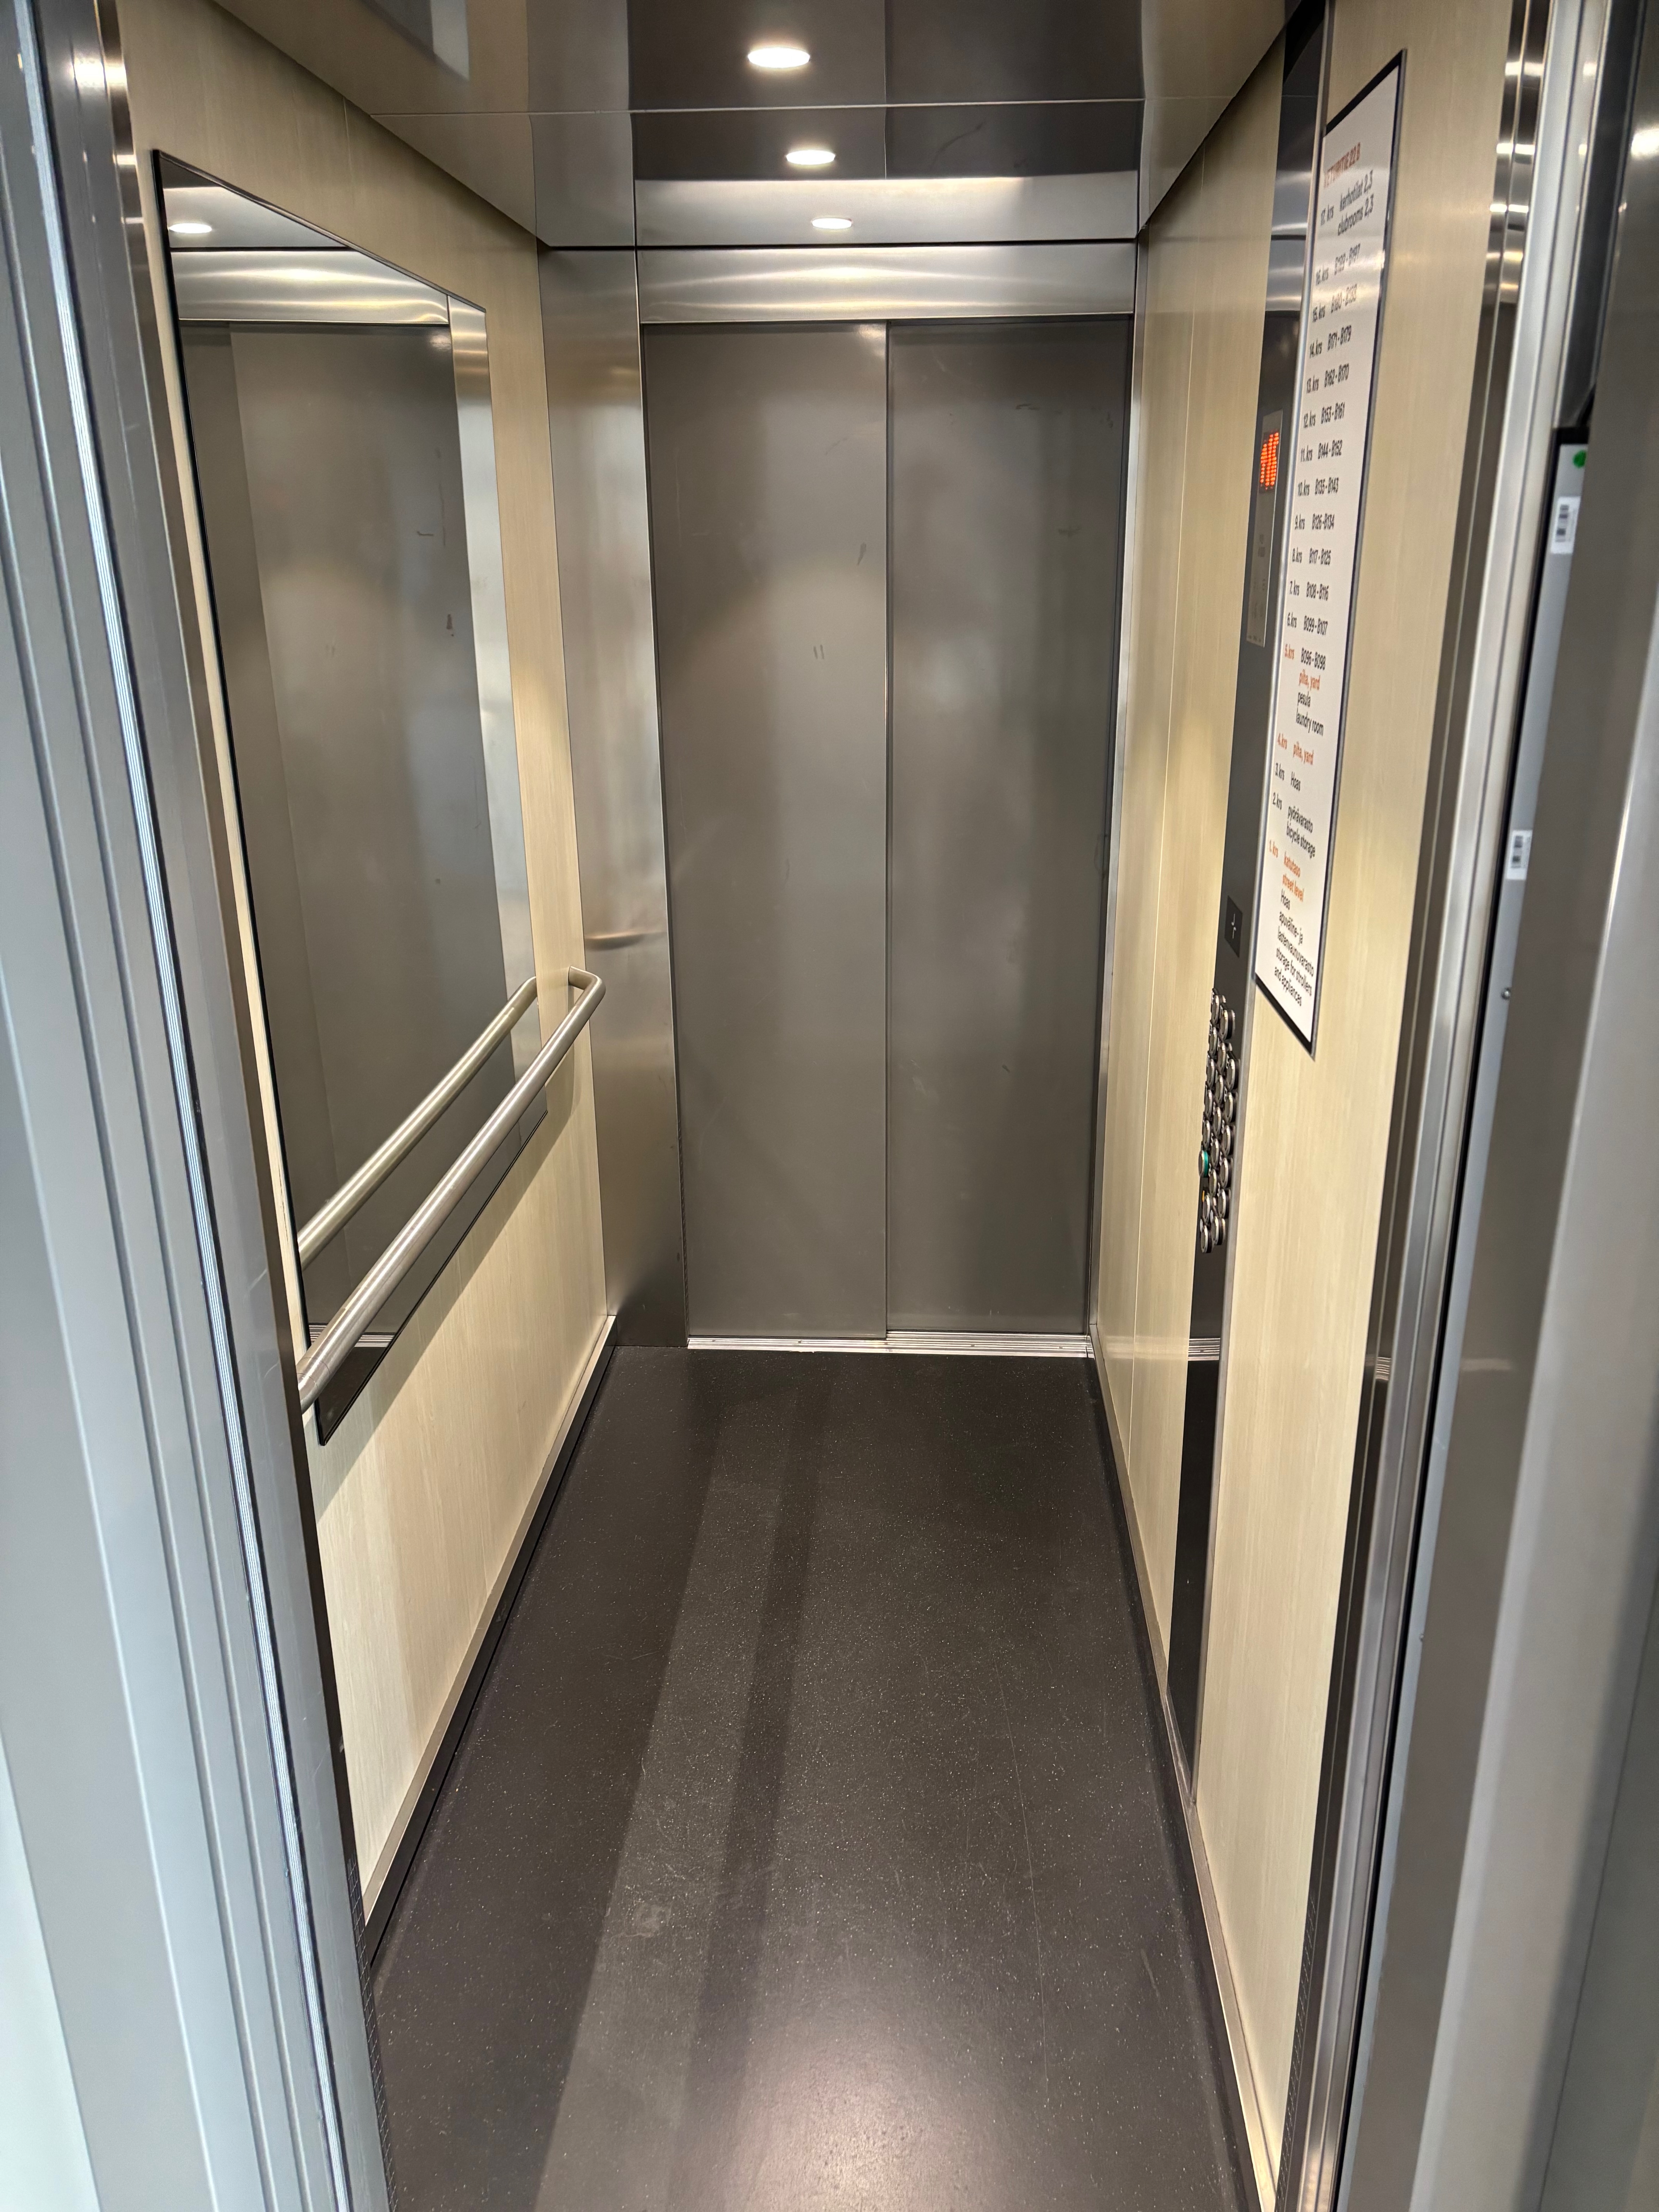
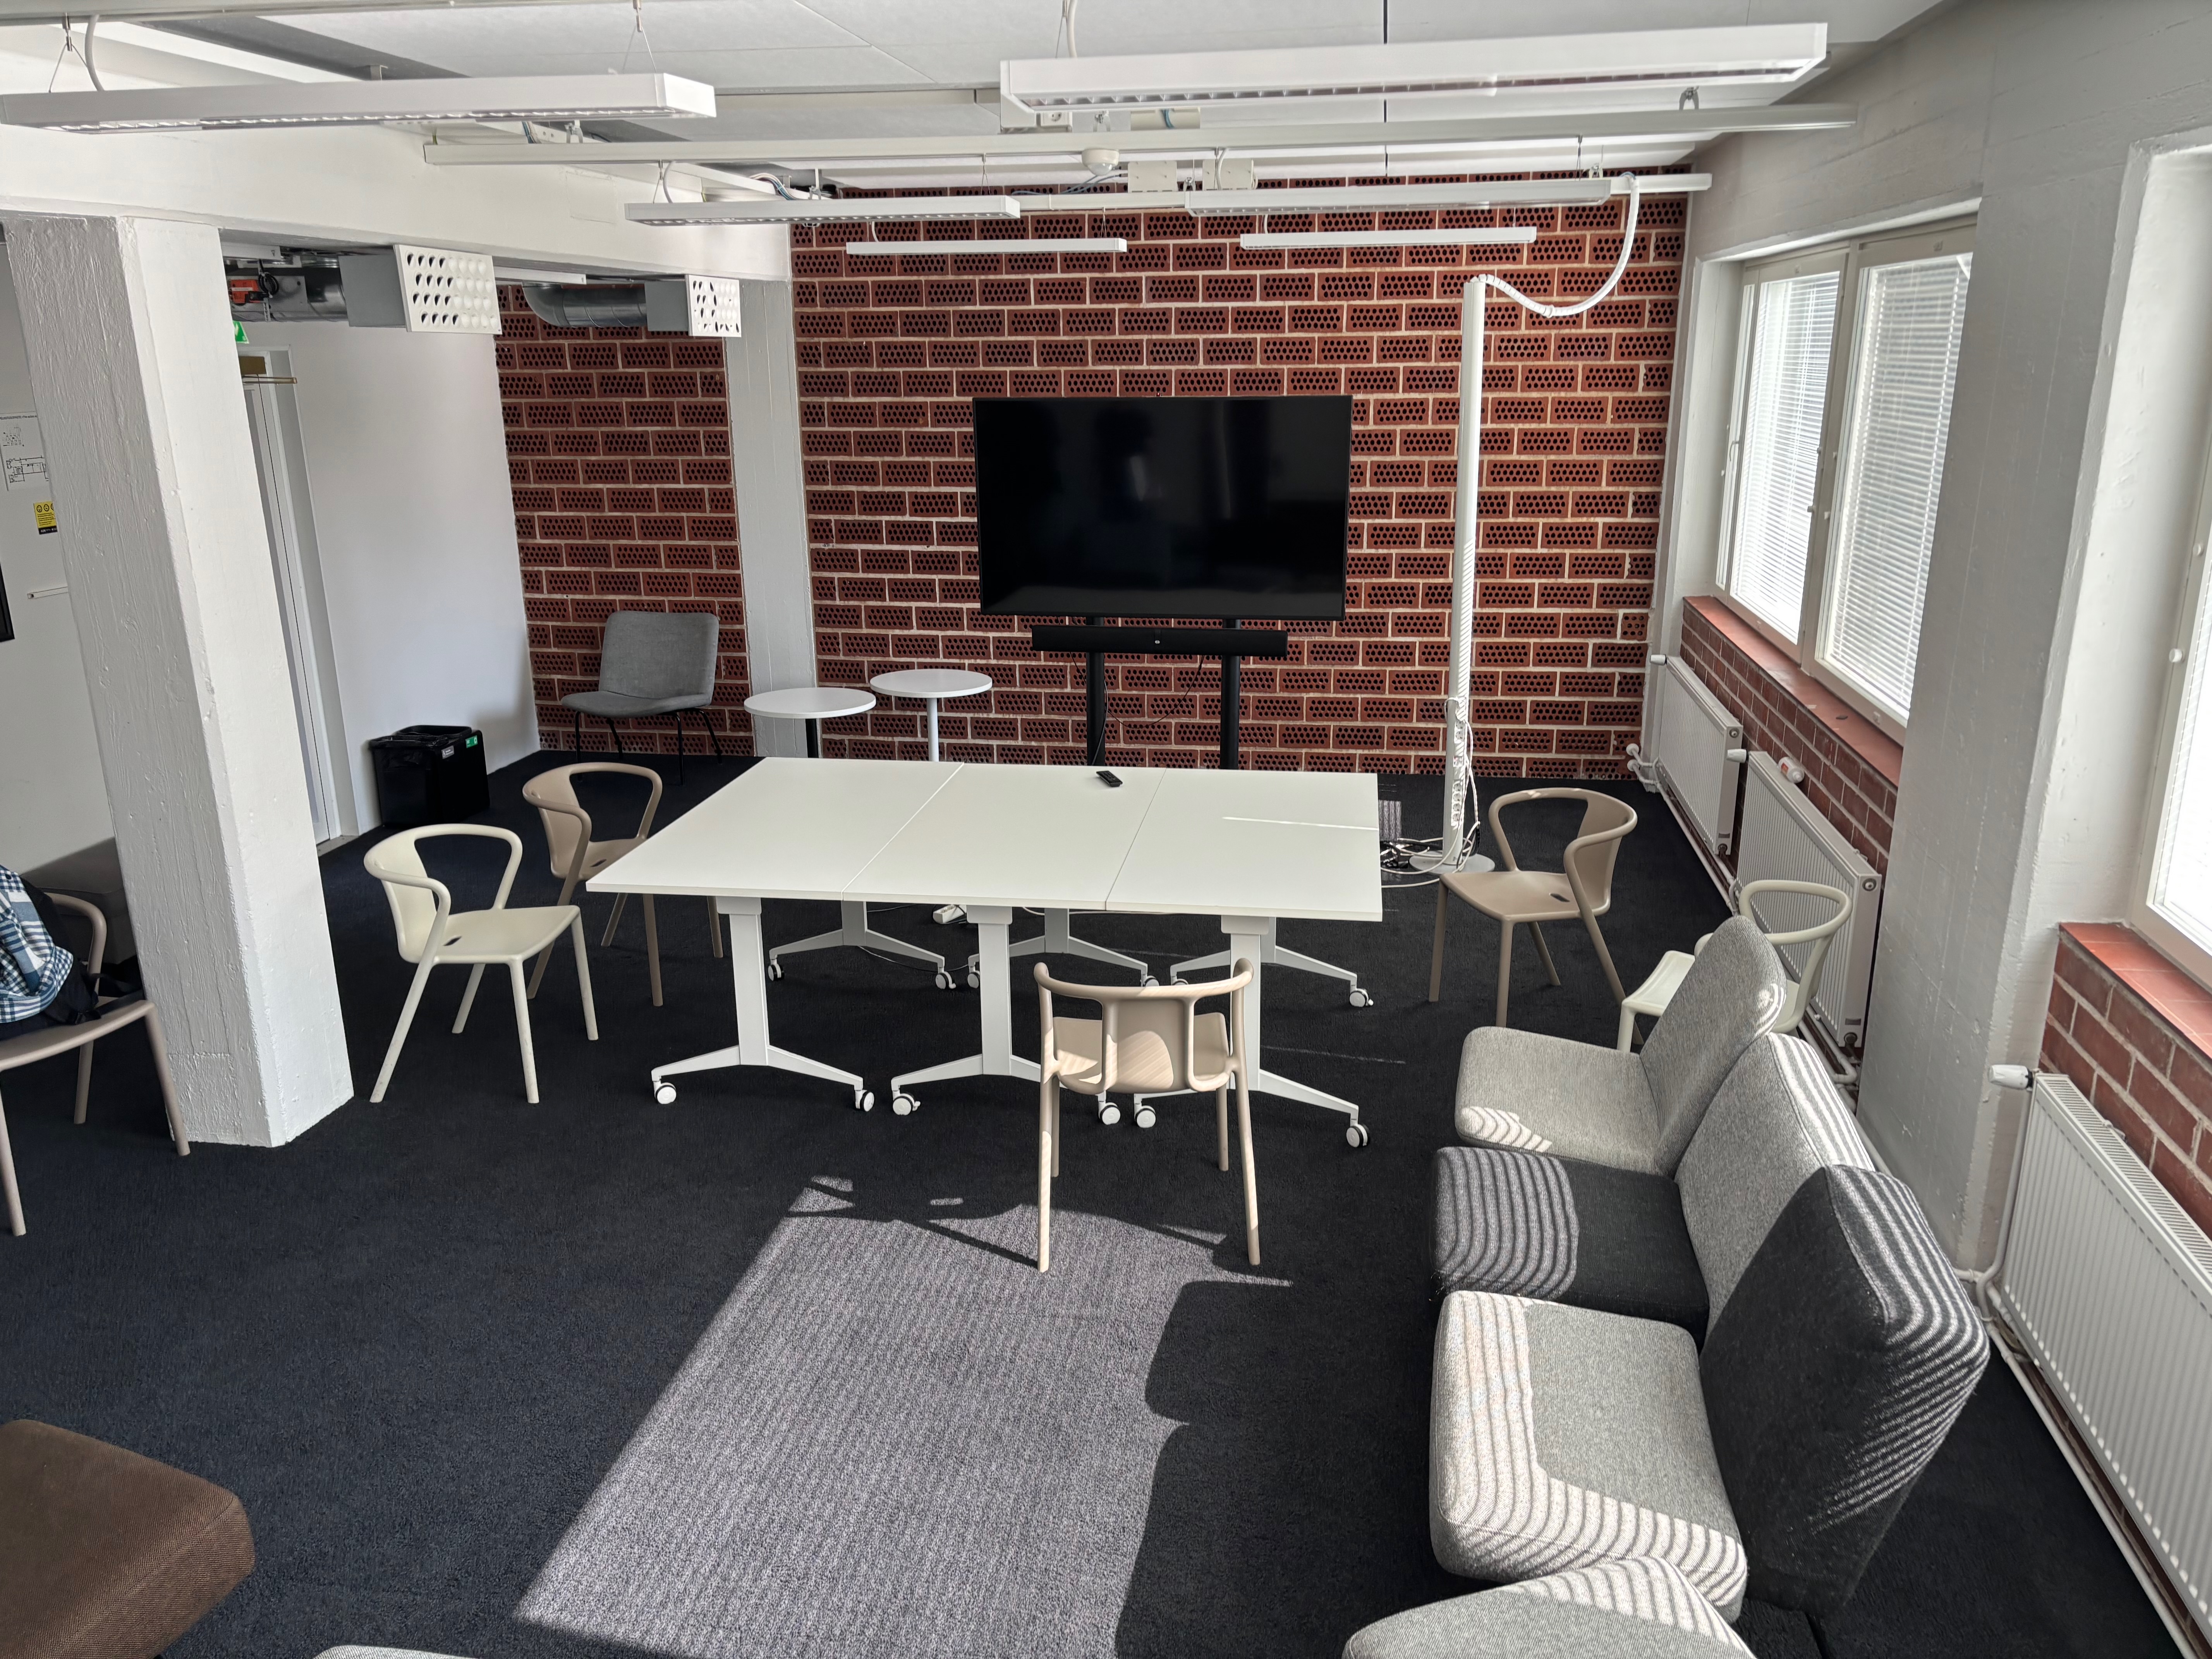
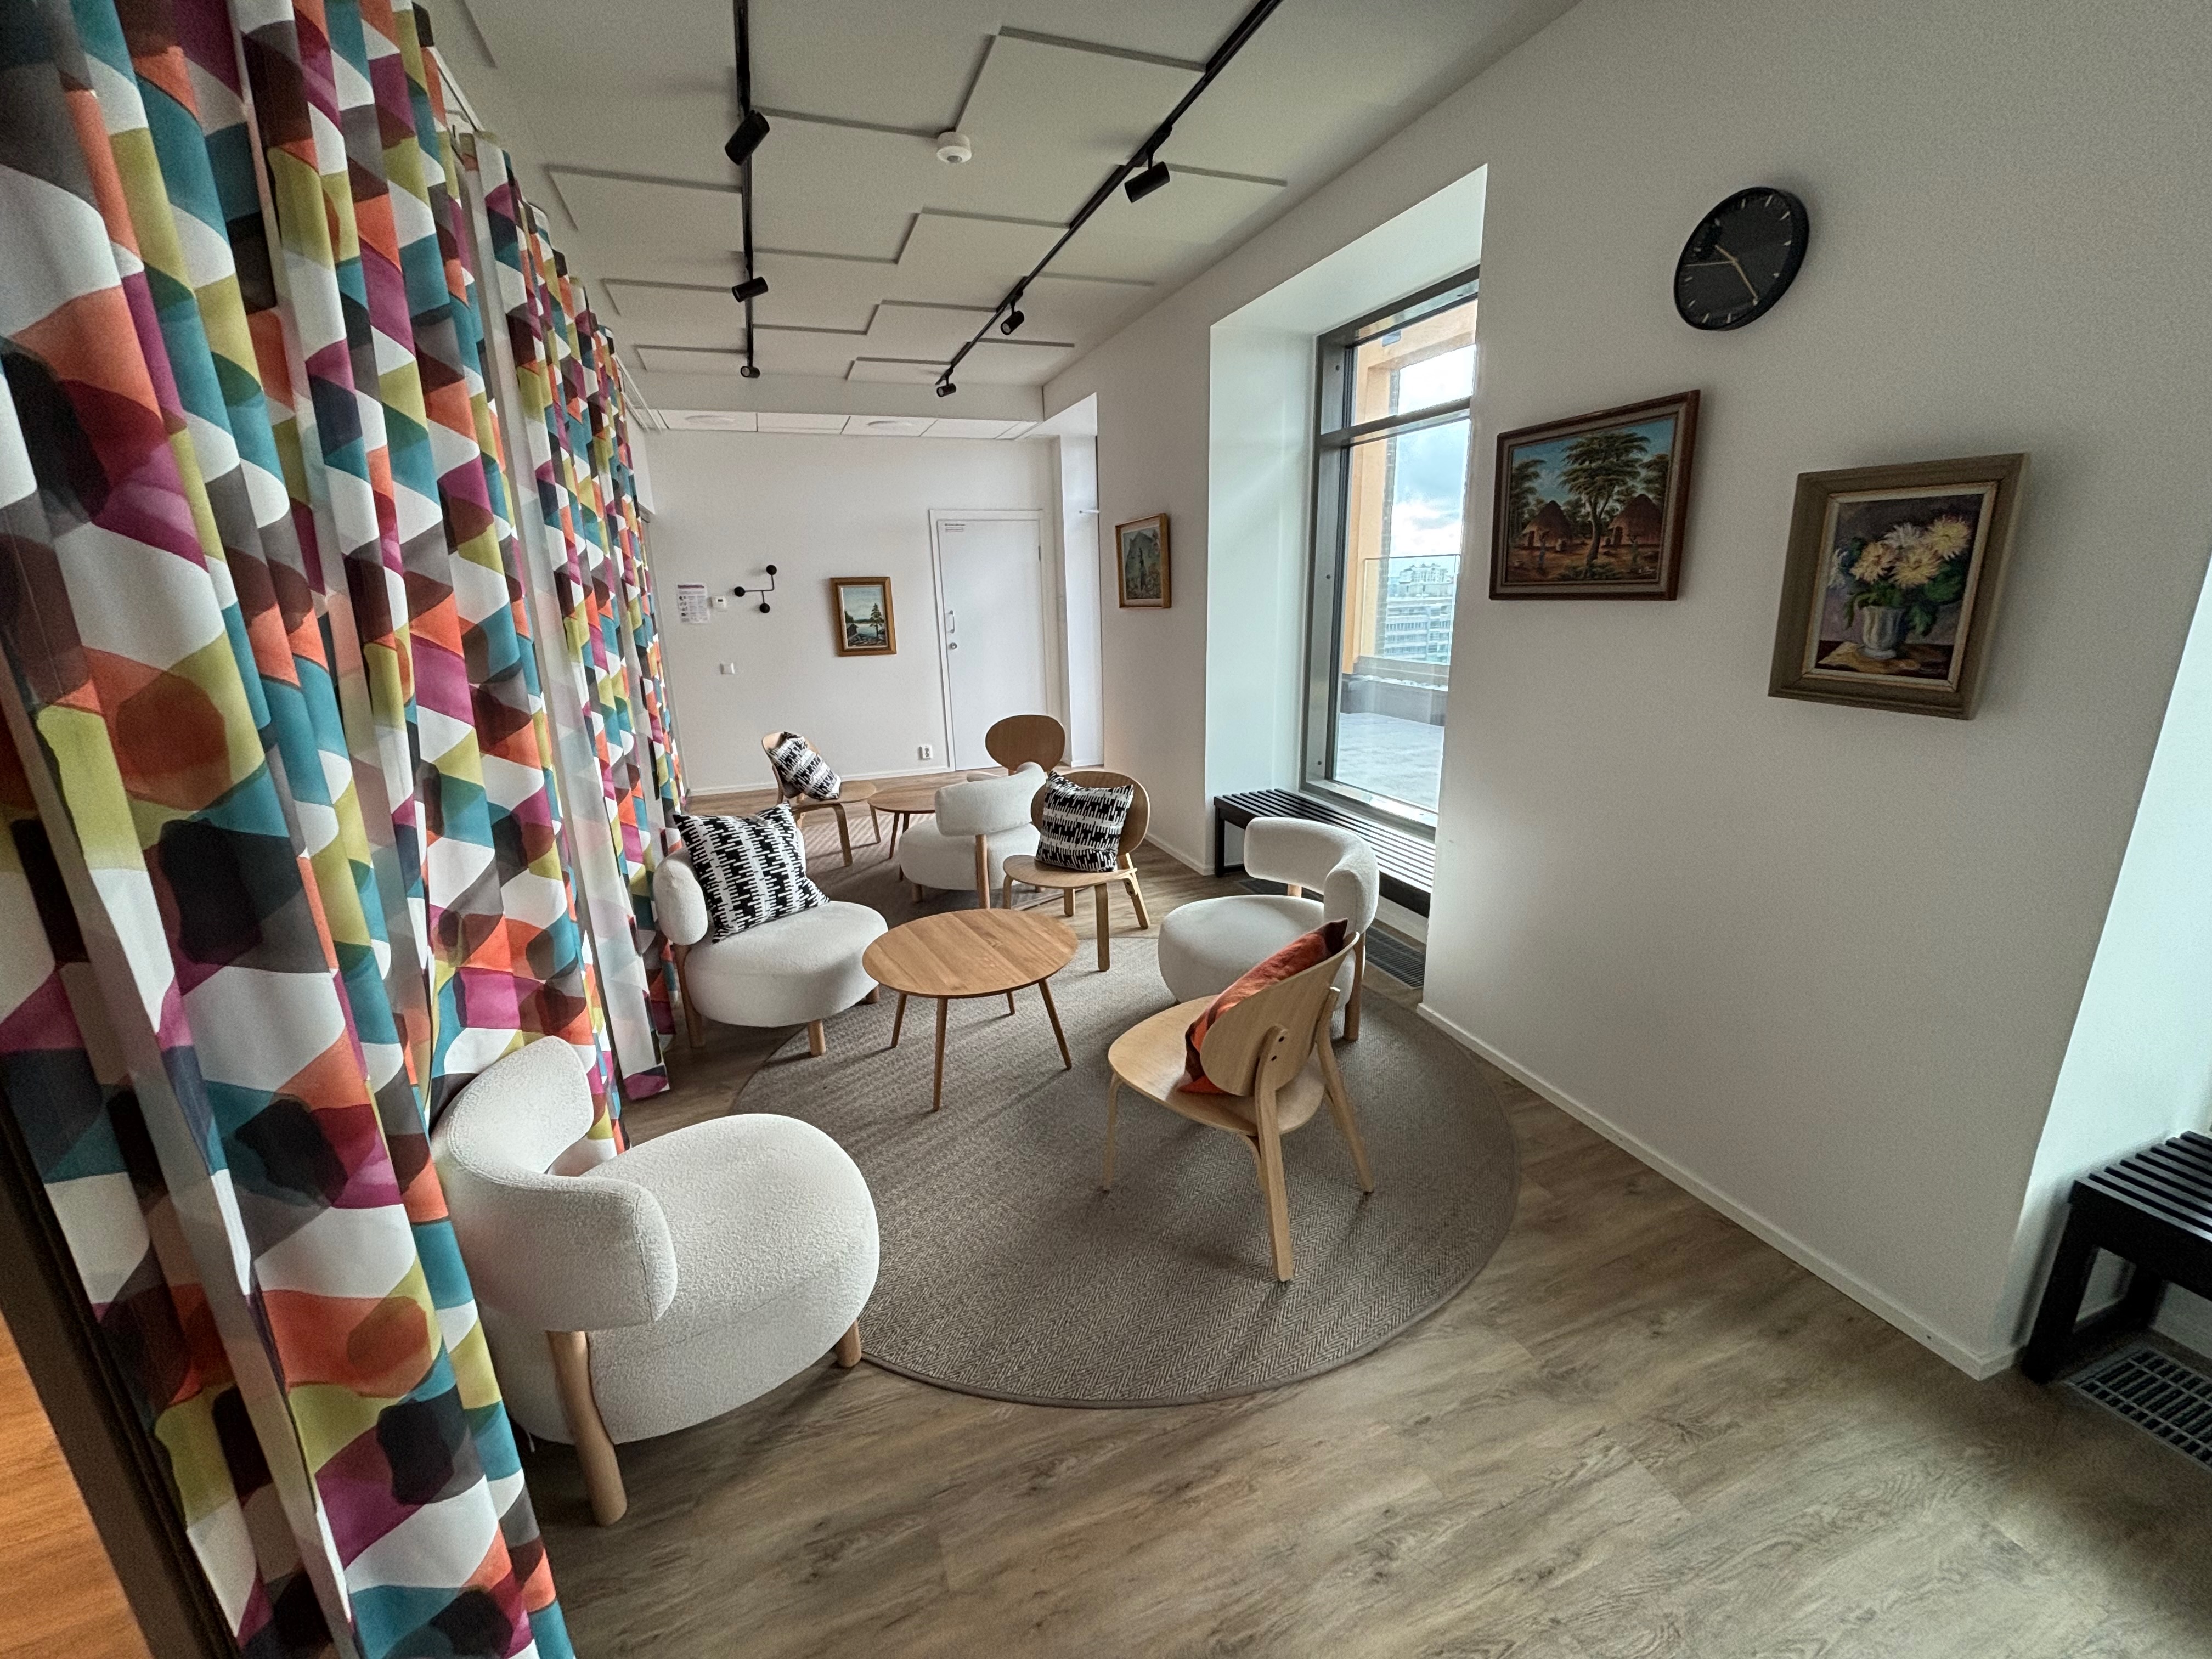
Photographs from the seven phone-recording rooms.

Anechoic handclap examples

The source handclaps were recorded with eight microphones in the large anechoic chamber at Aalto University. Below are five retained examples from different participants. These listening files preserve each complete retained event on the primary microphone channel.

Participant IDs are kept for provenance. We do not assign P1/A1 or other pose labels to these individual anechoic events, because their retained-event metadata do not establish those labels.

Participant 01

Block 01, clap 01 · 0.26 s

Participant 02

Block 01, clap 01 · 0.26 s

Participant 04

Block 01, clap 01 · 0.26 s

Participant 05

Block 03, clap 01 · 0.26 s

Participant 07

Block 01, clap 01 · 0.26 s

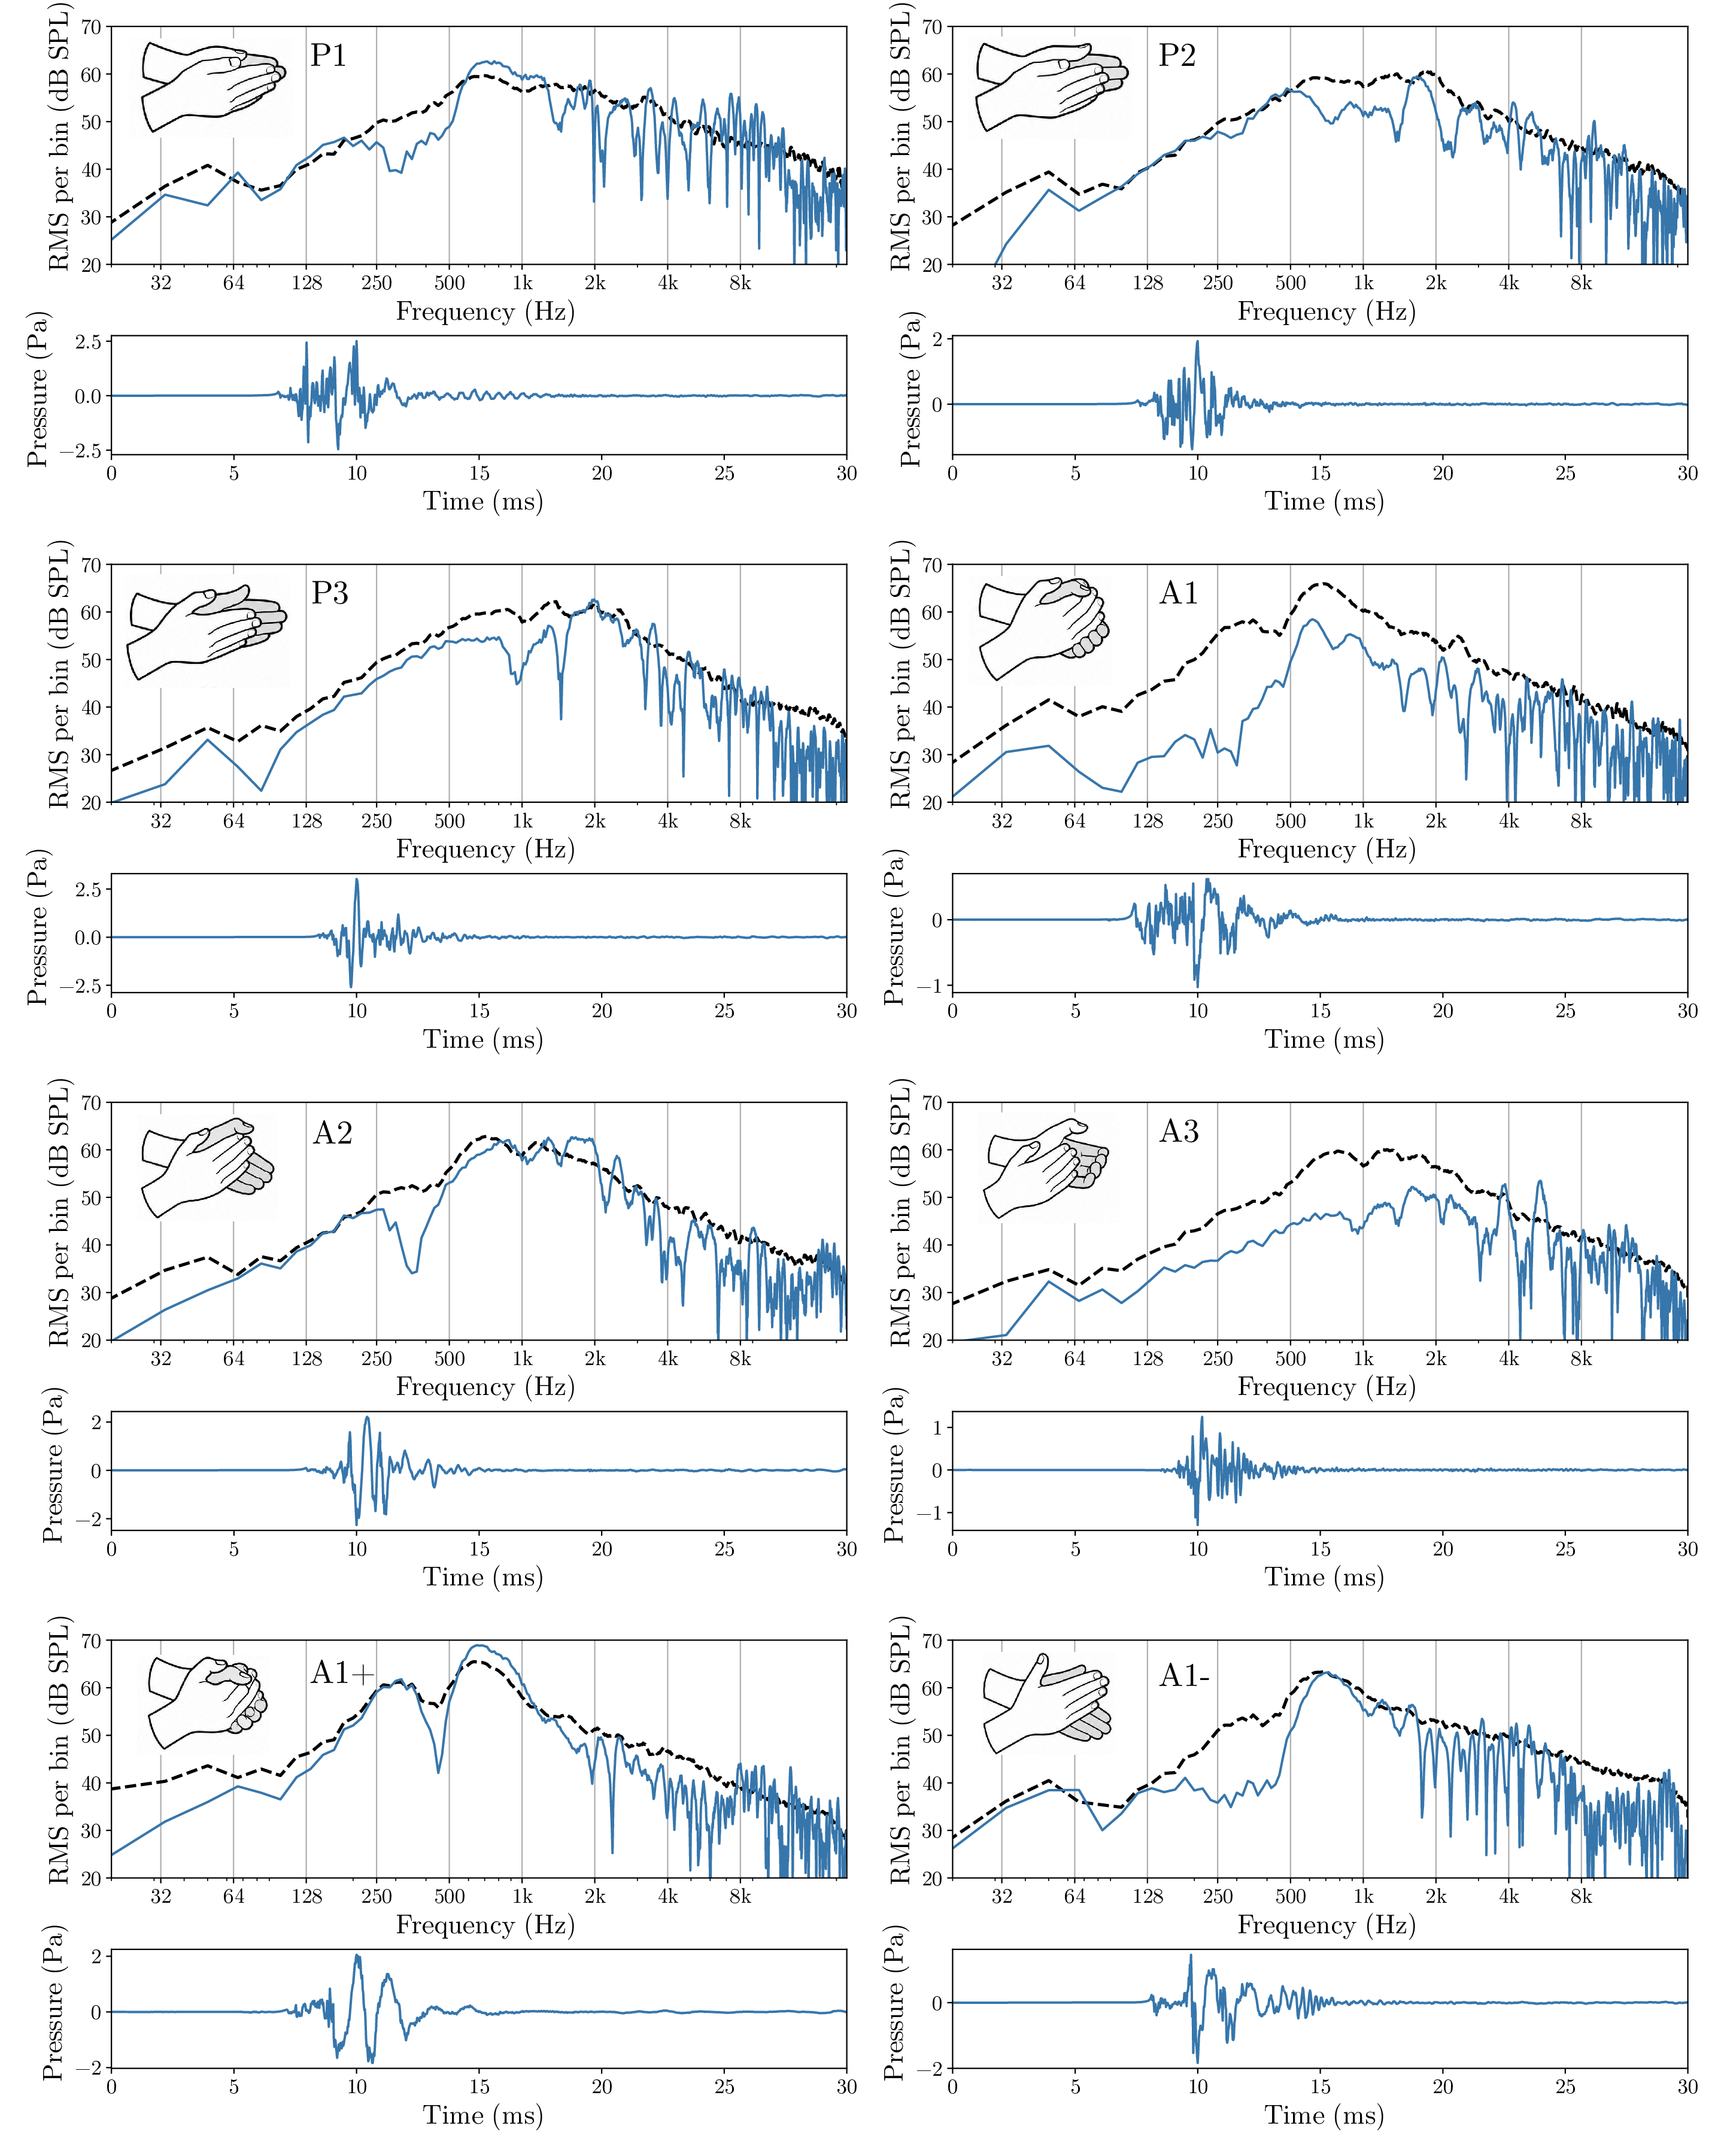
Eight handclap poses with their spectra and pressure waveforms

Hand-pose reference with spectra and pressure waveforms. The listening examples above are separate retained events; their individual pose labels are not established by the available metadata.

Project code and release information · Benchmark participant split

Project link

https://akinesia112.github.io/ClapRIR/

Asset manifest · Source and processing notes · Website repository